27 properties · Huntly, Huntly

Mary Street, Huntly

Mary Street in Huntly has 27 properties, valued by the council between $400,000 and $590,000 with a median of $510,000 (Huntly: $485,000). More of its homes were built in the 1950s than in any other decade. We estimate its homes at a median $545,500. 3 sold in the last twelve months, for a median $560,000. The highest sale in 2026 was 21 Mary Street, at $560,000.
$510kmedian council valuation
$546kour median estimate
$560kmedian sale, last 12 months · 3 sales
1950median year built
HuntlyHuntly ×Mary Street ×

27 properties on Mary Street, Huntly

Highest and lowest on Mary Street

Highest-valued home15 Mary Street$590,000council valuation · 3 bed · 146 m² floor · 911 m² land
Lowest-valued home1 Mary Street$400,000council valuation · 2 bed · 100 m² floor
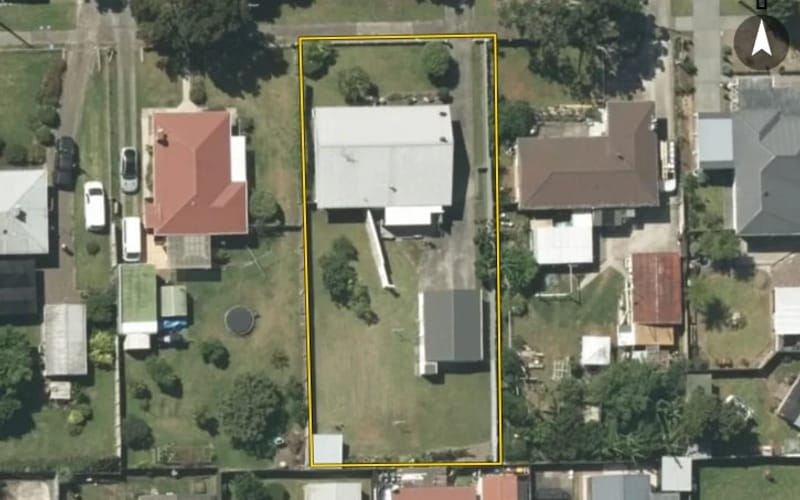
Highest sale in 202621 Mary Street$560,000sold 12 Feb 2026 · 3 bed · 107 m² floor · 911 m² land

Property values on Mary Street

The council values Mary Street's 26 rated properties between $400,000 and $590,000. The middle half sit between about $478,750 and $530,000; the median is $510,000 and the mean $506,154.

Lowest: $400k$400kLowest10%: $453k20%: $460k20%30%: $498k40%: $500k40%Median: $510k60%: $520k60%70%: $530k80%: $530k80%90%: $555kHighest: $590k$590kHighest
BedroomsHomesMedian council valueSold, last 12 monthsMedian sale
24$458k0—
322$520k3$560k

Council rating valuations: the council's figure for apportioning rates, not a market appraisal.

Mary Street compared with Huntly

Mary Street's median council value is 5% above Huntly's.

Mary StreetHuntlyHuntly
Median council value$510k$485k$490k
Median sale, last 12 months$560k$513k$535k
Sold in the last 12 months11.1%2.9%2.8%
Median section911 m²856 m²950 m²
Median year built195019701970
Council value per m² of floor$5k$4k$4k

Mary Street house prices over time

Median sale price by year; 2026 is the year so far. A year with fewer than two sales has no bar.

2016: $260k (6 sales)$260k2017: $365k (5 sales)20172018: $305k (2 sales)2019: $393k (2 sales)20192020: too few sales to say (1 sale)2021: $553k (4 sales)$553k20212022: too few sales to say (1 sale)2024: too few sales to say (1 sale)20242025: too few sales to say (1 sale)2026: $505k (2 sales, this year so far)$505k2026
Sales by year as a table
YearSalesMedian pricePer m² floor
20262$504,750$4,490
20251$629,000$4,308
20241$545,000$6,193
20221$420,000$4,200
20214$552,500$6,118
20201$385,000$4,477
20192$392,500$3,413
20182$305,000$3,377
20175$365,000$3,479
20166$260,000$2,814

Recent sales on Mary Street

  • 22 Mary Street$449,50023 Apr 2026 · 3 bed · 120 m² floor
  • 21 Mary Street$560,00012 Feb 2026 · 3 bed · 107 m² floor · 911 m² land
  • 15 Mary Street$629,00018 Nov 2025 · 3 bed · 146 m² floor · 911 m² land
  • 27 Mary Street$545,00012 Apr 2024 · 3 bed · 88 m² floor · 911 m² land
  • 1 Mary Street$420,0007 Sept 2022 · 2 bed · 100 m² floor
  • 19 Mary Street$580,00013 Dec 2021 · 3 bed · 88 m² floor · 911 m² land
  • 27 Mary Street$585,0008 May 2021 · 3 bed · 88 m² floor · 911 m² land
  • 4 Mary Street$525,0003 May 2021 · 3 bed · 93 m² floor · 647 m² land
  • 18 Mary Street$432,50029 Apr 2021 · 3 bed · 85 m² floor · 809 m² land
  • 2 Mary Street$385,00018 Aug 2020 · 2 bed · 86 m² floor · 707 m² land
  • 22 Mary Street$410,0006 Nov 2019 · 3 bed · 120 m² floor
  • 20 Mary Street$375,00025 Jun 2019 · 3 bed · 110 m² floor · 809 m² land
  • 11 Mary Street$375,00010 Nov 2018 · 3 bed · 94 m² floor · 911 m² land
  • 18 Mary Street$235,00013 Sept 2018 · 3 bed · 85 m² floor · 809 m² land
  • 7 Mary Street$354,90010 Nov 2017 · 3 bed · 102 m² floor · 911 m² land
  • 22 Mary Street$365,0005 Oct 2017 · 3 bed · 120 m² floor
  • 29 Mary Street$385,00020 Aug 2017 · 3 bed · 98 m² floor · 1,085 m² land
  • 19 Mary Street$340,0007 Aug 2017 · 3 bed · 88 m² floor · 911 m² land
  • 3 Mary Street$399,00018 Jan 2017 · 3 bed · 116 m² floor · 911 m² land
  • 21 Mary Street$395,00027 Sept 2016 · 3 bed · 107 m² floor · 911 m² land

The homes on Mary Street

Mary Street has 25 houses and 2 units and townhouses. More were built in the 1950s than in any other decade (35%).

1910s: 1 (1 home)11910s1920s: 3 (3 homes)1920s1930s: 4 (4 homes)1930s1950s: 9 (9 homes)91950s1960s: 8 (8 homes)1960s1980s: 1 (1 home)11980s

Sales and valuations as at 11 September 2026, from council and LINZ records. Medians resting on fewer than 3 sales are not shown.