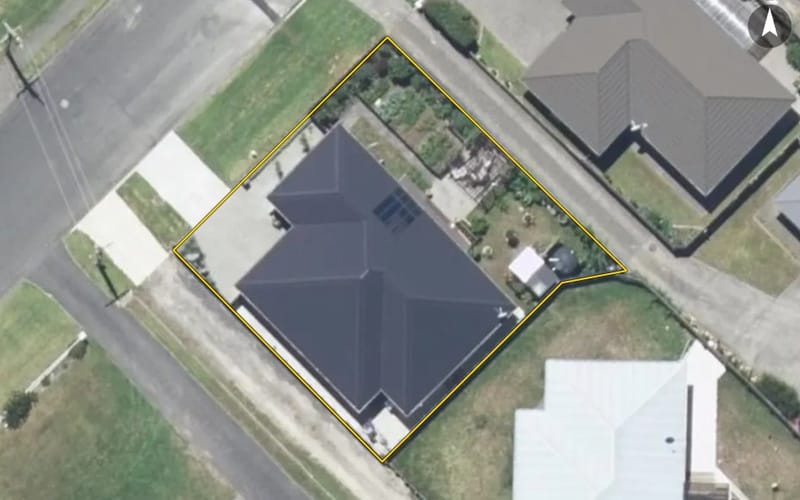
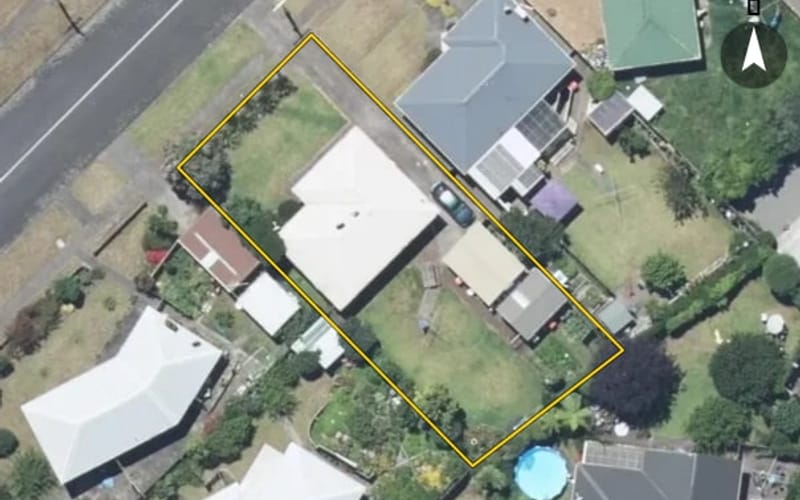
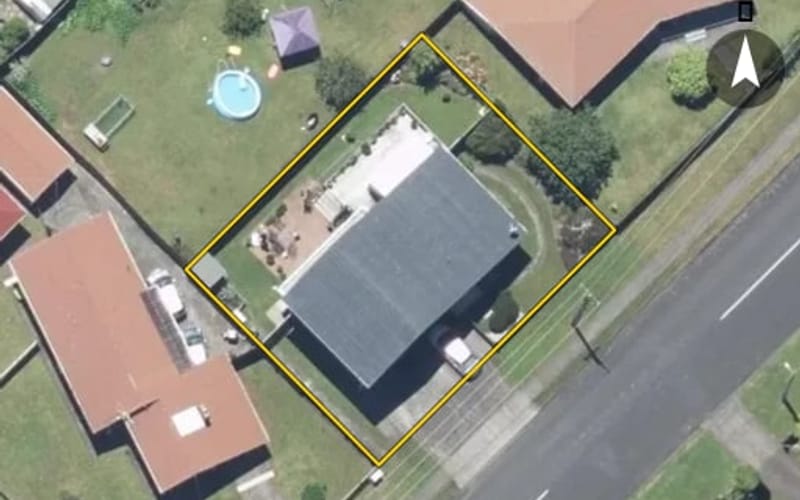
55 properties · Springvale, Whanganui

Oxford Road, Springvale

Oxford Road in Springvale has 55 properties, valued by the council between $340,000 and $800,000 with a median of $540,000 (Springvale: $560,000). Most of its homes were built in the 1960s. We estimate its homes at a median $549,000. 1 sold in the last twelve months.
$540kmedian council valuation
$549kour median estimate
1sold in the last 12 months
1960median year built
WhanganuiSpringvale ×Oxford Road ×

55 properties on Oxford Road, Springvale

Highest and lowest on Oxford Road

Highest-valued home28A Oxford Road$800,000council valuation · 4 bed · 227 m² floor · 1,458 m² land
Lowest-valued home3/30 Oxford Road$340,000council valuation · 2 bed · 100 m² floor
Highest sale, last 12 months51 Oxford Road$575,000sold 8 Oct 2025 · 3 bed · 95 m² floor · 605 m² land

Property values on Oxford Road

The council values Oxford Road's 51 rated properties between $340,000 and $800,000. The middle half sit between about $485,000 and $595,000; the median is $540,000 and the mean $539,118.

Lowest: $340k$340kLowest10%: $445k20%: $480k20%30%: $490k40%: $510k40%Median: $540k60%: $550k60%70%: $570k80%: $620k80%90%: $650kHighest: $800k$800kHighest
BedroomsHomesMedian council valueSold, last 12 monthsMedian sale
11$540k0—
23$350k0—
343$540k1—
43$550k0—

Council rating valuations: the council's figure for apportioning rates, not a market appraisal.

Oxford Road compared with Springvale

Oxford Road's median council value is 4% below Springvale's.

Oxford RoadSpringvaleWhanganui
Median council value$540k$560k$480k
Sold in the last 12 months1.8%3.7%3.2%
Median section605 m²690 m²809 m²
Median year built196019801960
Council value per m² of floor$4k$4k$4k

Oxford Road house prices over time

Median sale price by year; 2025 is the year so far. A year with fewer than two sales has no bar.

2016: $227k (3 sales)$227k2017: $248k (2 sales)20172018: $310k (4 sales)2019: $400k (3 sales)20192020: $432k (4 sales)2021: too few sales to say (1 sale)20212022: $620k (2 sales)$620k2023: too few sales to say (1 sale)20232024: $549k (2 sales)2025: $565k (2 sales, this year so far)$565k2025
Sales by year as a table
YearSalesMedian pricePer m² floor
20252$565,000$5,526
20242$548,750$4,126
20231$570,000$7,037
20222$620,000$5,217
20211$550,000$4,622
20204$431,500$3,296
20193$400,000$3,053
20184$310,000$2,591
20172$247,500$2,677
20163$227,000$2,142

Recent sales on Oxford Road

  • 51 Oxford Road$575,0008 Oct 2025 · 3 bed · 95 m² floor · 605 m² land
  • 77 Oxford Road$555,00010 Jan 2025 · 3 bed · 111 m² floor · 600 m² land
  • 53 Oxford Road$522,5007 Nov 2024 · 3 bed · 100 m² floor · 582 m² land
  • 4 Oxford Road$575,00019 Aug 2024 · 4 bed · 190 m² floor · 490 m² land
  • 73 Oxford Road$570,00024 Nov 2023 · 3 bed · 81 m² floor · 635 m² land
  • 45 Oxford Road$530,00011 Aug 2022 · 3 bed · 120 m² floor · 865 m² land
  • 26 Oxford Road$710,0009 Feb 2022 · 3 bed · 118 m² floor · 384 m² land
  • 28 Oxford Road$550,00031 Aug 2021 · 3 bed · 119 m² floor · 510 m² land
  • 25A Oxford Road$483,00028 Nov 2020 · 3 bed · 141 m² floor · 403 m² land
  • 45 Oxford Road$380,00014 May 2020 · 3 bed · 120 m² floor · 865 m² land
  • 79 Oxford Road$515,00030 Apr 2020 · 3 bed · 180 m² floor · 508 m² land
  • 41 Oxford Road$362,00017 Feb 2020 · 3 bed · 100 m² floor · 556 m² land
  • 71 Oxford Road$471,00024 Oct 2019 · 3 bed · 210 m² floor · 626 m² land
  • 46 Oxford Road$400,00010 Oct 2019 · 3 bed · 131 m² floor · 620 m² land
  • 77 Oxford Road$339,00031 May 2019 · 3 bed · 111 m² floor · 600 m² land
  • 2 Oxford Road$350,00012 Dec 2018 · 3 bed · 120 m² floor · 514 m² land
  • 51 Oxford Road$300,00019 Oct 2018 · 3 bed · 95 m² floor · 605 m² land
  • 3/30 Oxford Road$226,50018 Apr 2018 · 2 bed · 100 m² floor
  • 34C Oxford Road$320,00012 Apr 2018 · 3 bed · 147 m² floor · 524 m² land
  • 69 Oxford Road$260,00013 Nov 2017 · 3 bed · 106 m² floor · 617 m² land

The homes on Oxford Road

Oxford Road has 48 houses and 7 units and townhouses. Most were built in the 1960s (51%).

1920s: 1 (1 home)11920s1950s: 4 (4 homes)1960s: 26 (26 homes)261960s1970s: 4 (4 homes)1980s: 1 (1 home)1980s1990s: 6 (6 homes)2000s: 4 (4 homes)2000s2010s: 3 (3 homes)2020s: 2 (2 homes)22020s

Sales and valuations as at 11 September 2026, from council and LINZ records. Medians resting on fewer than 3 sales are not shown.