57 properties · Matua, Tauranga

Tilby Drive, Matua

Tilby Drive in Matua has 57 properties, valued by the council between $670,000 and $3,010,000 with a median of $1,220,000 (Matua: $1,020,000). Most of its homes were built in the 1970s. We estimate its homes at a median $1,250,000. 1 sold in the last twelve months. The highest sale in 2026 was 44A Tilby Drive, at $1,270,000.
$1.22mmedian council valuation
$1.25mour median estimate
1sold in the last 12 months
1970median year built
TaurangaMatua ×Tilby Drive ×

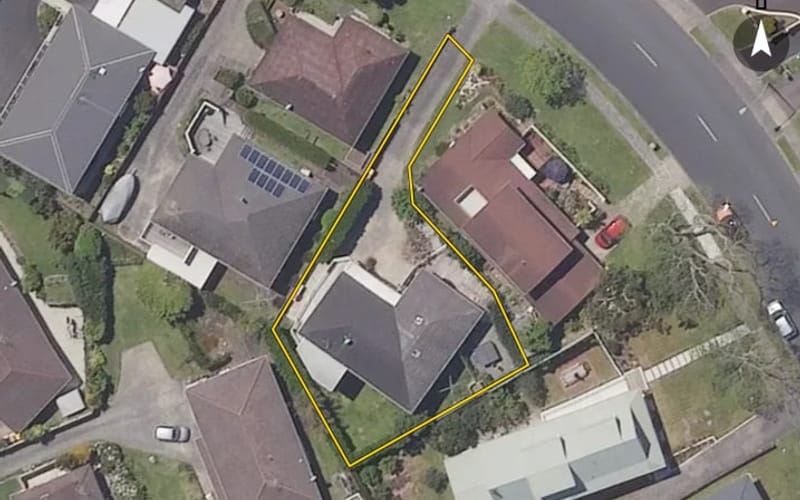
57 properties on Tilby Drive, Matua

Highest and lowest on Tilby Drive

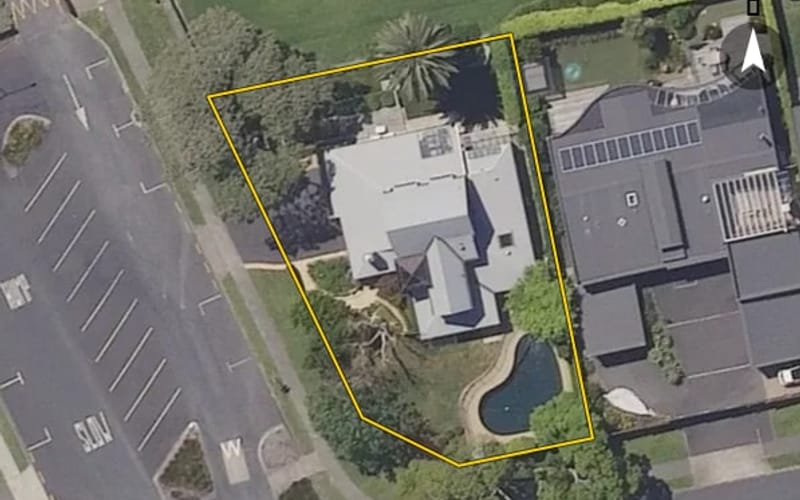
Highest-valued home70 Tilby Drive$3,010,000council valuation · 5 bed · 350 m² floor · 605 m² land
Lowest-valued home2 Tilby Drive$670,000council valuation · 3 bed · 86 m² floor · 293 m² land
Highest sale in 202644A Tilby Drive$1,270,000sold 23 Feb 2026 · 4 bed · 230 m² floor · 524 m² land

Property values on Tilby Drive

The council values Tilby Drive's 39 rated properties between $670,000 and $3,010,000. The middle half sit between about $991,000 and $1,498,000; the median is $1,220,000 and the mean $1,311,538.

Lowest: $670k$670kLowest10%: $826k20%: $932k20%30%: $1.05m40%: $1.16m40%Median: $1.22m60%: $1.36m60%70%: $1.43m80%: $1.57m80%90%: $1.73mHighest: $3.01m$3.01mHighest
BedroomsHomesMedian council valueSold, last 12 monthsMedian sale
313$905k0—
418$1.29m1—
5+8$1.55m0—

Council rating valuations: the council's figure for apportioning rates, not a market appraisal.

Tilby Drive compared with Matua

Tilby Drive's median council value is 20% above Matua's.

Tilby DriveMatuaTauranga
Median council value$1.22m$1.02m$875k
Sold in the last 12 months1.8%3.5%3.9%
Median section806 m²711 m²670 m²
Median year built197019701990
Council value per m² of floor$5k$6k$6k

Tilby Drive house prices over time

Median sale price by year; 2026 is the year so far. A year with fewer than two sales has no bar.

2016: $970k (3 sales)$970k2017: $614k (2 sales)20172018: $815k (5 sales)2019: $754k (3 sales)20192020: $1.41m (3 sales)2021: $1.34m (2 sales)20212023: $2.01m (2 sales)$2.01m2024: $1.15m (4 sales)$1.15m20242025: too few sales to say (1 sale)2026: too few sales to say (1 sale, this year so far)2026
Sales by year as a table
YearSalesMedian pricePer m² floor
20261$1,270,000$5,522
20251$1,150,000$4,656
20244$1,152,500$5,643
20232$2,007,500$7,144
20212$1,337,500$5,901
20203$1,410,000$5,000
20193$754,000$4,610
20185$815,000$4,167
20172$614,125$4,926
20163$970,000$3,278

Recent sales on Tilby Drive

  • 44A Tilby Drive$1,270,00023 Feb 2026 · 4 bed · 230 m² floor · 524 m² land
  • 44 Tilby Drive$1,150,00017 Jul 2025 · 3 bed · 247 m² floor · 436 m² land
  • 19B Tilby Drive$730,0006 Sept 2024 · 3 bed · 150 m² floor · 398 m² land
  • 19A Tilby Drive$900,00018 Apr 2024 · 3 bed · 190 m² floor · 412 m² land
  • 16 Tilby Drive$1,405,00016 Mar 2024 · 3 bed · 210 m² floor · 723 m² land
  • 12A Tilby Drive$1,470,00029 Feb 2024 · 3 bed · 229 m² floor · 408 m² land
  • 57 Tilby Drive$1,020,00010 Dec 2023 · 3 bed · 178 m² floor
  • 70 Tilby Drive$2,995,00015 Aug 2023 · 5 bed · 350 m² floor · 605 m² land
  • 12A Tilby Drive$1,430,00014 Nov 2021 · 3 bed · 229 m² floor · 408 m² land
  • 12 Tilby Drive$1,245,0003 Oct 2021 · 4 bed · 224 m² floor · 383 m² land
  • 70 Tilby Drive$2,600,00021 Nov 2020 · 5 bed · 350 m² floor · 605 m² land
  • 4 Tilby Drive$938,00029 Oct 2020 · 4 bed · 230 m² floor · 318 m² land
  • 60 Tilby Drive$1,410,00018 Jan 2020 · 5 bed · 282 m² floor · 809 m² land
  • 2 Tilby Drive$500,0008 Aug 2019 · 3 bed · 86 m² floor · 293 m² land
  • 60 Tilby Drive$1,300,00013 May 2019 · 5 bed · 282 m² floor · 809 m² land
  • 19A Tilby Drive$754,00010 Apr 2019 · 3 bed · 190 m² floor · 412 m² land
  • 36 Tilby Drive$898,00015 Dec 2018 · 4 bed · 180 m² floor · 817 m² land
  • 16 Tilby Drive$727,00015 Aug 2018 · 3 bed · 210 m² floor · 723 m² land
  • 8 Tilby Drive$935,0006 Apr 2018 · 4 bed · 350 m² floor · 1,234 m² land
  • 21 Tilby Drive$750,00013 Feb 2018 · 4 bed · 180 m² floor · 809 m² land

The homes on Tilby Drive

Tilby Drive has 34 houses and 22 units and townhouses. Most were built in the 1970s (54%).

1960s: 2 (2 homes)21960s1970s: 21 (21 homes)211970s1980s: 6 (6 homes)1980s1990s: 4 (4 homes)1990s2000s: 2 (2 homes)2000s2010s: 3 (3 homes)2010s2020s: 1 (1 home)12020s

Sales and valuations as at 11 September 2026, from council and LINZ records. Medians resting on fewer than 3 sales are not shown.