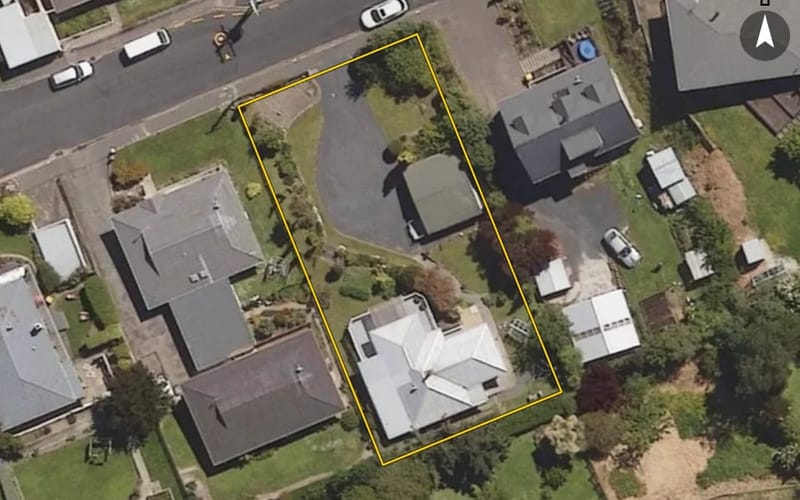
39 properties · Kinmont Park, Mosgiel

Clyde Street, Kinmont Park

Clyde Street in Kinmont Park has 39 properties, valued by the council between $220,000 and $1,340,000 with a median of $620,000 (Kinmont Park: $680,000). More of its homes were built in the 1970s than in any other decade. We estimate its homes at a median $657,500. 1 sold in the last twelve months.
$620kmedian council valuation
$658kour median estimate
1sold in the last 12 months
1960median year built
MosgielKinmont Park ×Clyde Street ×

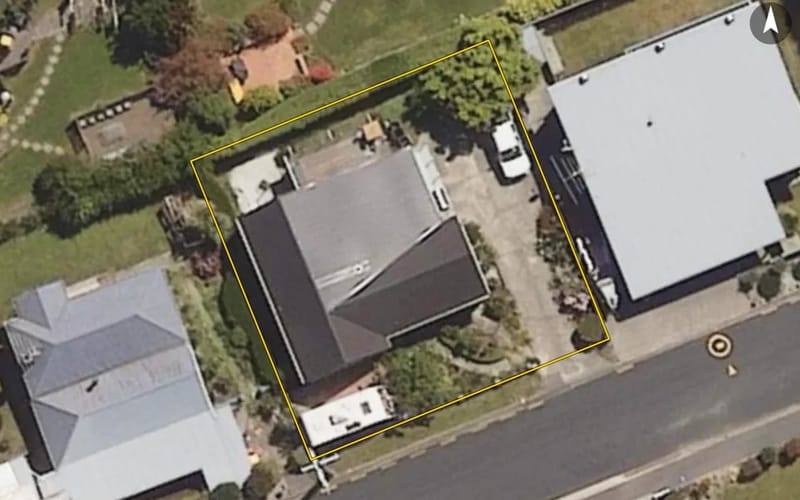
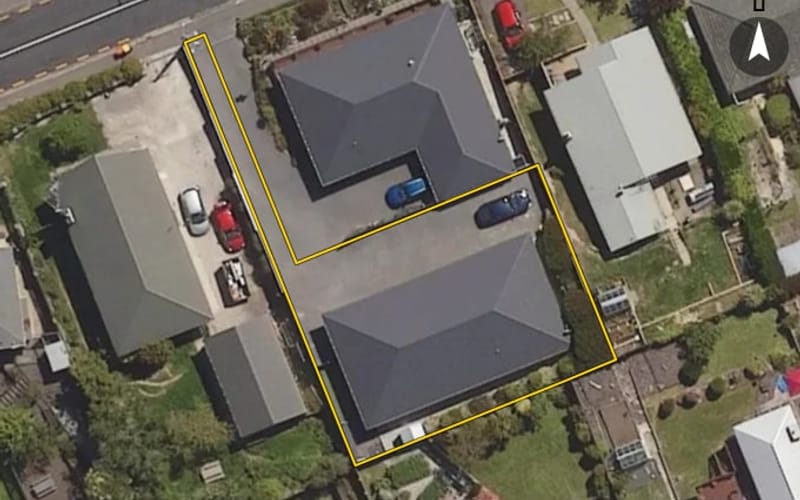
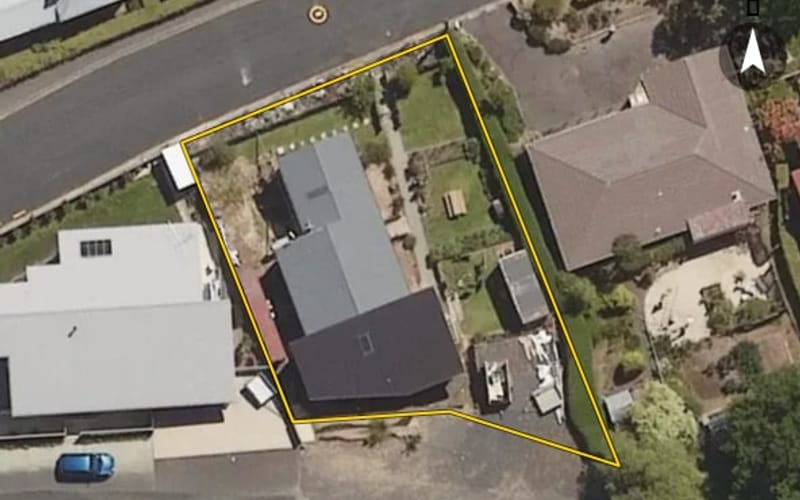
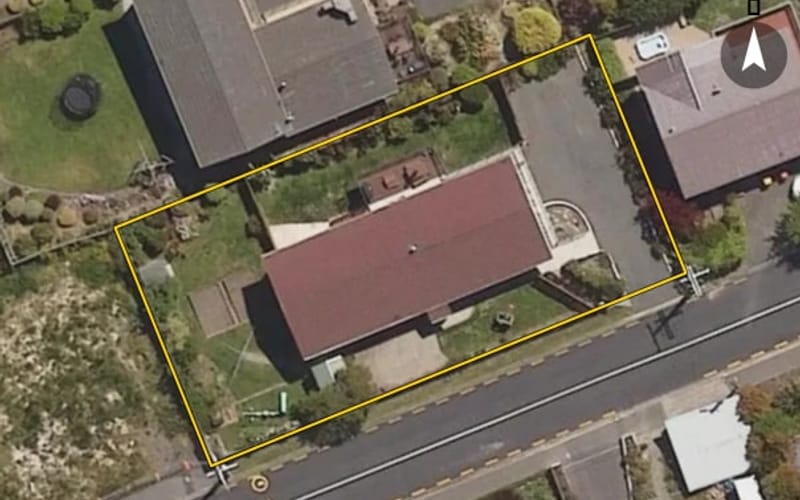
39 properties on Clyde Street, Kinmont Park

Highest and lowest on Clyde Street

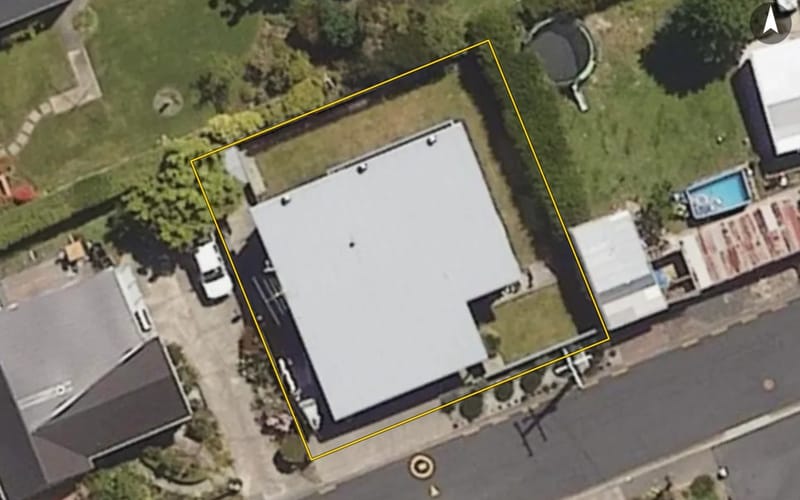
Highest-valued home32 Clyde Street$1,340,000council valuation · 436 m² floor · 809 m² land
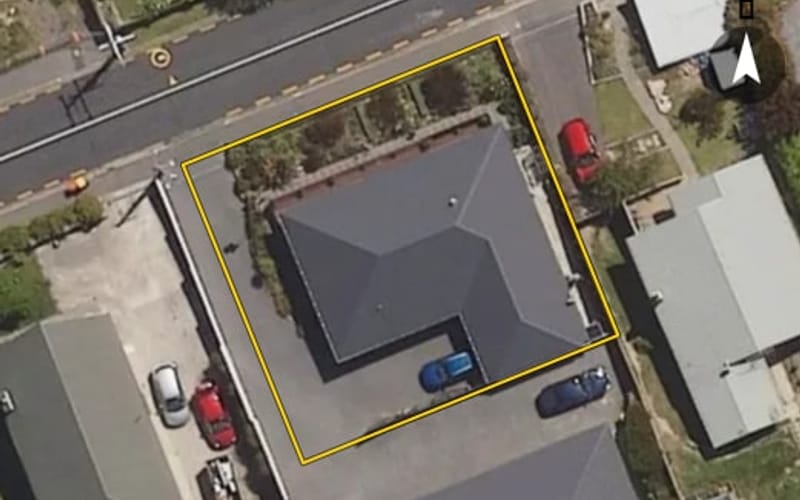
Lowest-valued home17 Clyde Street$220,000council valuation · 3 bed · 80 m² floor · 385 m² land
Highest sale, last 12 months2 Clyde Street$745,000sold 12 Dec 2025 · 3 bed · 143 m² floor · 809 m² land

Property values on Clyde Street

The council values Clyde Street's 38 rated properties between $220,000 and $1,340,000. The middle half sit between about $543,000 and $701,500; the median is $620,000 and the mean $627,368.

Lowest: $220k$220kLowest10%: $466k20%: $534k20%30%: $552k40%: $580k40%Median: $620k60%: $642k60%70%: $689k80%: $714k80%90%: $770kHighest: $1.34m$1.34mHighest
BedroomsHomesMedian council valueSold, last 12 monthsMedian sale
23$480k0—
331$620k1—
43$760k0—

Council rating valuations: the council's figure for apportioning rates, not a market appraisal.

Clyde Street compared with Kinmont Park

Clyde Street's median council value is 9% below Kinmont Park's.

Clyde StreetKinmont ParkMosgiel
Median council value$620k$680k$688k
Sold in the last 12 months2.6%2.8%4.6%
Time between sales5.4 yrs8.3 yrs8.0 yrs
Median section738 m²769 m²733 m²
Median year built196019701980
Council value per m² of floor$5k$5k$5k

Clyde Street house prices over time

Median sale price by year; 2025 is the year so far. A year with fewer than two sales has no bar.

2016: $470k (3 sales)$470k2017: $372k (4 sales)20172018: too few sales to say (1 sale)2019: $466k (3 sales)20192020: $545k (4 sales)2021: $671k (2 sales)$671k20212022: $661k (4 sales)2023: $570k (3 sales)20232024: $620k (5 sales)$620k2025: too few sales to say (1 sale, this year so far)2025
Sales by year as a table
YearSalesMedian pricePer m² floor
20251$745,000$5,210
20245$620,000$4,628
20233$570,000$4,831
20224$661,250$5,573
20212$670,500$3,790
20204$545,000$4,581
20193$465,500$3,471
20181$375,000$3,409
20174$371,500$3,149
20163$470,000$2,883

Recent sales on Clyde Street

  • 2 Clyde Street$745,00012 Dec 2025 · 3 bed · 143 m² floor · 809 m² land
  • 37 Clyde Street$535,0006 Sept 2024 · 2 bed · 100 m² floor · 809 m² land
  • 14B Clyde Street$790,0005 Aug 2024 · 3 bed · 163 m² floor · 500 m² land
  • 19 Clyde Street$620,00012 Jul 2024 · 3 bed · 260 m² floor · 384 m² land
  • 12 Clyde Street$560,0006 Jul 2024 · 3 bed · 121 m² floor · 622 m² land
  • 11 Clyde Street$655,00011 May 2024 · 3 bed · 190 m² floor · 405 m² land
  • 16 Clyde Street$610,00011 Oct 2023 · 3 bed · 120 m² floor · 809 m² land
  • 18 Clyde Street$570,00010 Jun 2023 · 3 bed · 118 m² floor · 809 m² land
  • 32 Clyde Street$180,00029 Mar 2023 · 436 m² floor · 809 m² land
  • 19 Clyde Street$640,0009 Dec 2022 · 3 bed · 260 m² floor · 384 m² land
  • 14A Clyde Street$870,00019 May 2022 · 3 bed · 164 m² floor · 500 m² land
  • 27 Clyde Street$625,00013 Apr 2022 · 3 bed · 107 m² floor · 649 m² land
  • 6 Clyde Street$682,5008 Mar 2022 · 3 bed · 102 m² floor · 809 m² land
  • 23 Clyde Street$541,0005 Aug 2021 · 3 bed · 130 m² floor · 651 m² land
  • 5 Clyde Street$800,0001 Apr 2021 · 3 bed · 234 m² floor · 404 m² land
  • 10 Clyde Street$610,0008 Nov 2020 · 3 bed · 120 m² floor · 809 m² land
  • 18 Clyde Street$560,00028 Oct 2020 · 3 bed · 118 m² floor · 809 m² land
  • 16 Clyde Street$530,00031 Jan 2020 · 3 bed · 120 m² floor · 809 m² land
  • 32 Clyde Street$250,00015 Jan 2020 · 436 m² floor · 809 m² land
  • 13 Clyde Street$610,00025 Sept 2019 · 3 bed · 145 m² floor · 809 m² land

The homes on Clyde Street

Clyde Street has 36 houses and 2 units and townhouses. More were built in the 1970s than in any other decade (26%).

1900s: 2 (2 homes)21910s: 4 (4 homes)1910s1920s: 1 (1 home)1930s: 1 (1 home)1930s1940s: 4 (4 homes)1950s: 4 (4 homes)1950s1960s: 4 (4 homes)1970s: 10 (10 homes)101970s1980s: 4 (4 homes)2000s: 1 (1 home)2000s2010s: 2 (2 homes)2020s: 1 (1 home)12020s

How long owners stay on Clyde Street

Homes on Clyde Street that resold in the last five years had been held a median 5.4 years (Kinmont Park: 8.3 years).

Time between a home's sales, for 12 resales in the last five years. A home not sold since our records begin is not counted, so owners who stay longest are under-represented.

Building and resource consents on Clyde Street

2building consents in the last 5 years
1resource consents in the last 5 years
  • 32 Clyde Street1 Dec 2023 · Building consentErect Dwelling with Basement Garage, Install Lift
  • 23 Clyde Street1 Jul 2022 · Building consentInstall free standing woodsman Brunner mkii in dwg
  • 32 Clyde Street2 May 2024 · Resource consentthe soil disturbance on a HAIL site under the NES-CS; earthworks to establish the dwelling and access breaching setback from network utilities and property boundaries; and contravention of the outdoor

Sales and valuations as at 11 September 2026, from council and LINZ records. Medians resting on fewer than 3 sales are not shown.