66 properties · Gonville, Whanganui

Tawa Street, Gonville

Tawa Street in Gonville has 66 properties, valued by the council between $240,000 and $4,400,000 with a median of $395,000 (Gonville: $415,000). More of its homes were built in the 1950s than in any other decade. We estimate its homes at a median $409,000. 2 sold in the last twelve months.
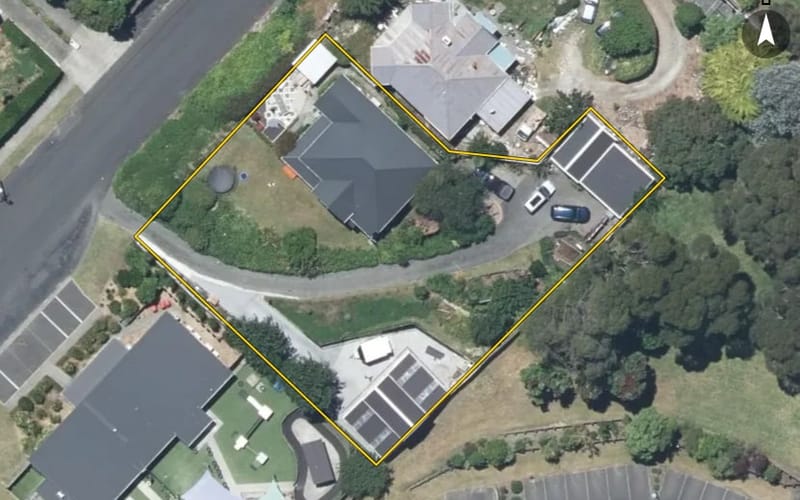
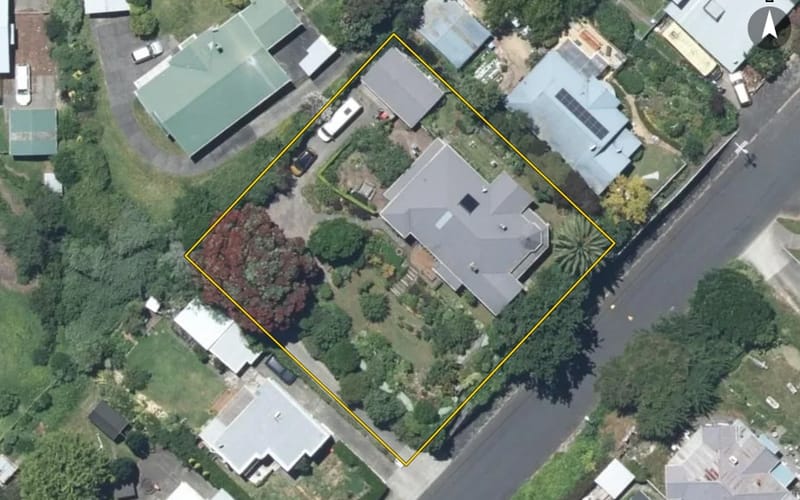
$395kmedian council valuation
$409kour median estimate
2sold in the last 12 months
1940median year built
WhanganuiGonville ×Tawa Street ×

66 properties on Tawa Street, Gonville

Highest and lowest on Tawa Street

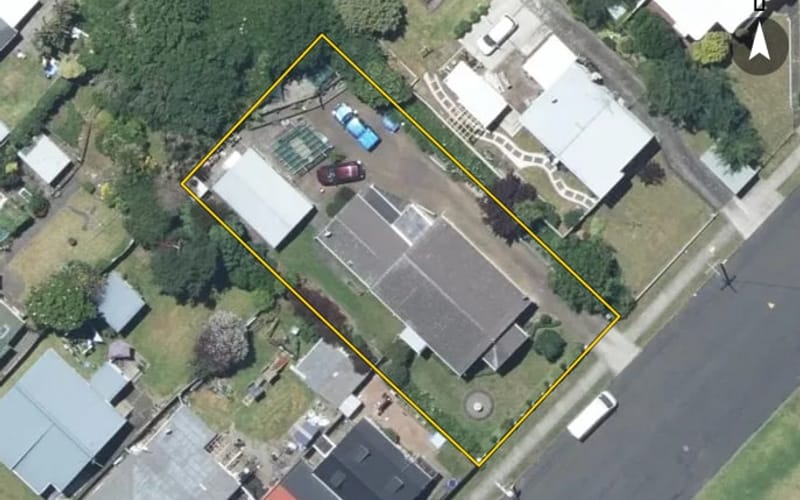
Highest-valued home30 Tawa Street$4,400,000council valuation · 1 bed · 1560 m² floor · 9,076 m² land
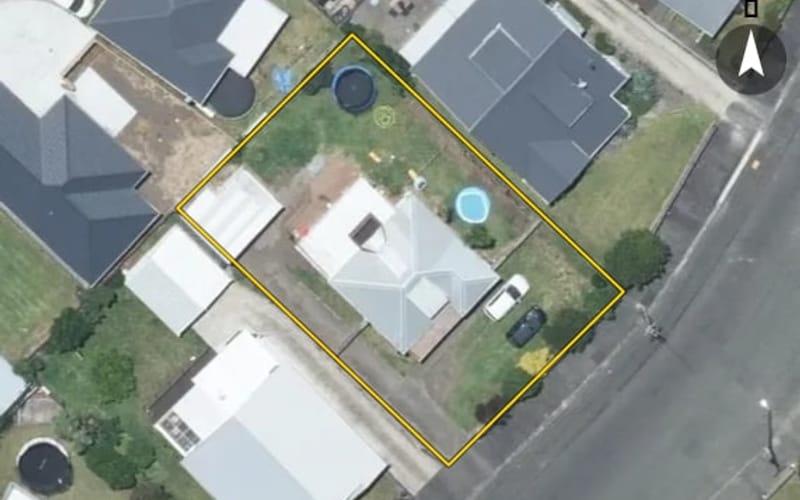
Lowest-valued home56 Tawa Street$240,000council valuation · 4 bed · 192 m² floor · 395 m² land
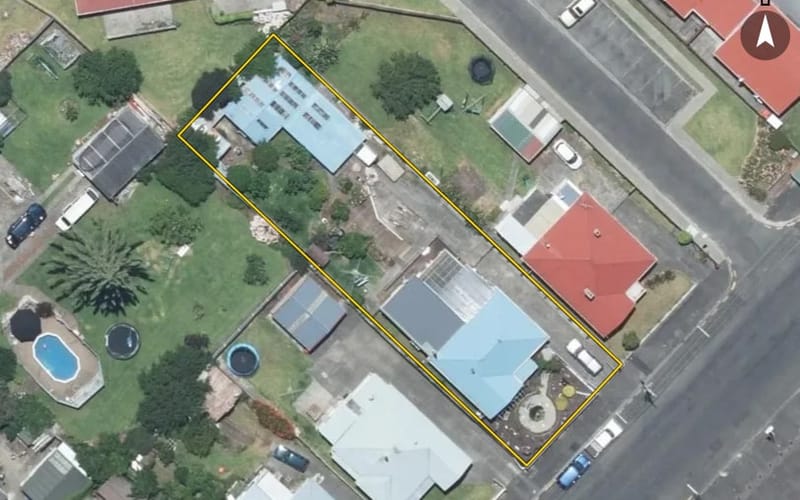
Highest sale, last 12 months36 Tawa Street$469,000sold 27 Dec 2025 · 4 bed · 166 m² floor · 549 m² land

Property values on Tawa Street

The council values Tawa Street's 53 rated properties between $240,000 and $4,400,000. The middle half sit between about $330,000 and $456,000; the median is $395,000 and the mean $479,623.

Lowest: $240k$240kLowest10%: $285k20%: $290k20%30%: $370k40%: $375k40%Median: $395k60%: $430k60%70%: $440k80%: $472k80%90%: $576kHighest: $4.4m$4.4mHighest
BedroomsHomesMedian council valueSold, last 12 monthsMedian sale
112$285k0—
25$370k1—
329$435k0—
46$433k1—
5+1$630k0—

Council rating valuations: the council's figure for apportioning rates, not a market appraisal.

Tawa Street compared with Gonville

Tawa Street's median council value is 5% below Gonville's.

Tawa StreetGonvilleWhanganui
Median council value$395k$415k$480k
Sold in the last 12 months3%3.9%3.2%
Time between sales7.3 yrs7.4 yrs7.9 yrs
Median section707 m²773 m²809 m²
Median year built194019501960
Council value per m² of floor$4k$4k$4k

Tawa Street house prices over time

Median sale price by year; 2025 is the year so far. A year with fewer than two sales has no bar.

2016: too few sales to say (1 sale)2017: $170k (5 sales)$170k20172018: $152k (5 sales)2019: $345k (4 sales)20192020: $363k (4 sales)2021: too few sales to say (1 sale)20212022: too few sales to say (1 sale)2023: $515k (2 sales)$515k20232024: $502k (5 sales)2025: $432k (6 sales, this year so far)$432k2025
Sales by year as a table
YearSalesMedian pricePer m² floor
20256$432,000$4,017
20245$502,000$3,600
20232$515,000$4,897
20221$375,000$4,688
20211$457,000$3,264
20204$363,000$3,235
20194$344,500$2,489
20185$152,000$1,476
20175$170,000$1,724
20161$170,000$1,349

Recent sales on Tawa Street

  • 36 Tawa Street$469,00027 Dec 2025 · 4 bed · 166 m² floor · 549 m² land
  • 42 Tawa Street$382,5008 Dec 2025 · 2 bed · 90 m² floor
  • 58 Tawa Street$325,0001 Sept 2025 · 3 bed · 155 m² floor · 368 m² land
  • 54 Tawa Street$470,00021 Aug 2025 · 3 bed · 109 m² floor · 516 m² land
  • 22 Tawa Street$395,00012 Mar 2025 · 2 bed · 100 m² floor
  • 1 Tawa Street$490,00029 Jan 2025 · 3 bed · 120 m² floor · 885 m² land
  • 29 Tawa Street$576,00018 Oct 2024 · 4 bed · 146 m² floor · 524 m² land
  • 22 Tawa Street$360,00023 Aug 2024 · 2 bed · 100 m² floor
  • 2 Tawa Street$650,0002 Aug 2024 · 6 bed · 268 m² floor · 741 m² land
  • 50 Tawa Street$502,0004 Jul 2024 · 3 bed · 127 m² floor · 541 m² land
  • 57 Tawa Street$400,00026 Jun 2024 · 3 bed · 123 m² floor · 1,005 m² land
  • 45 Tawa Street$440,00010 Nov 2023 · 3 bed · 71 m² floor · 574 m² land
  • 5 Tawa Street$590,00015 Jun 2023 · 3 bed · 164 m² floor · 673 m² land
  • 46A Tawa Street$375,00020 Dec 2022 · 3 bed · 80 m² floor
  • 32 Tawa Street$457,00023 Apr 2021 · 4 bed · 140 m² floor · 820 m² land
  • 16 Tawa Street$455,00023 Sept 2020 · 3 bed · 150 m² floor · 809 m² land
  • 67A Tawa Street$275,00021 Jul 2020 · 2 bed · 80 m² floor · 521 m² land
  • 33 Tawa Street$291,00030 Jan 2020 · 3 bed · 140 m² floor · 560 m² land
  • 3 Tawa Street$435,00013 Jan 2020 · 3 bed · 108 m² floor · 977 m² land
  • 29 Tawa Street$365,5004 Jul 2019 · 4 bed · 146 m² floor · 524 m² land

The homes on Tawa Street

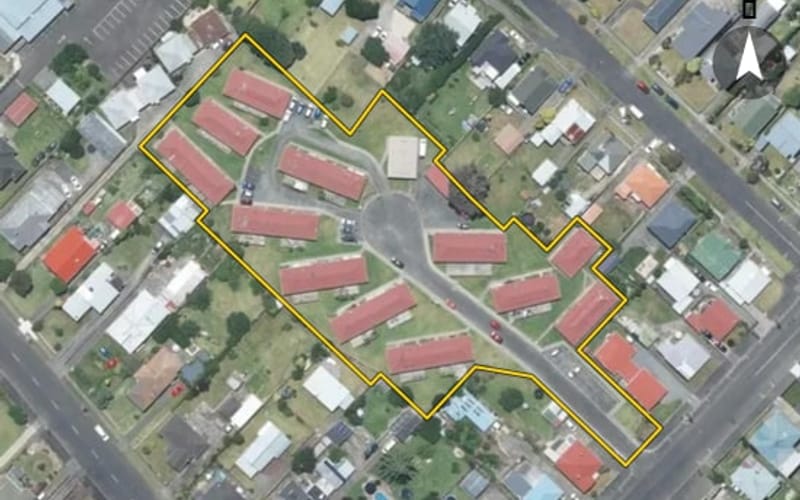
Tawa Street has 46 houses, 12 apartments and 8 units and townhouses. More were built in the 1950s than in any other decade (28%).

1900s: 1 (1 home)11900s1910s: 12 (12 homes)1920s: 12 (12 homes)1920s1940s: 5 (5 homes)1950s: 15 (15 homes)151950s1970s: 1 (1 home)1980s: 4 (4 homes)1980s1990s: 2 (2 homes)2020s: 1 (1 home)12020s

How long owners stay on Tawa Street

Homes on Tawa Street that resold in the last five years had been held a median 7.3 years (Gonville: 7.4 years).

Time between a home's sales, for 14 resales in the last five years. A home not sold since our records begin is not counted, so owners who stay longest are under-represented.

Building and resource consents on Tawa Street

1building consents in the last 5 years
3resource consents in the last 5 years
  • 39A Tawa Street1 Apr 2026 · Building consentConstruct a 10m x 7m x 2.4m gge
  • 37A Tawa Street9 Feb 2023 · Resource consentMicrobrewery
  • 31 Tawa Street27 Jun 2022 · Resource consentUse and development of land for an outbuilding (carport)
  • 15 Tawa Street27 Oct 2021 · Resource consentUse and development of land for a retaining wall

Sales and valuations as at 11 September 2026, from council and LINZ records. Medians resting on fewer than 3 sales are not shown.