
Estimate $1.07m – $1.42m
3
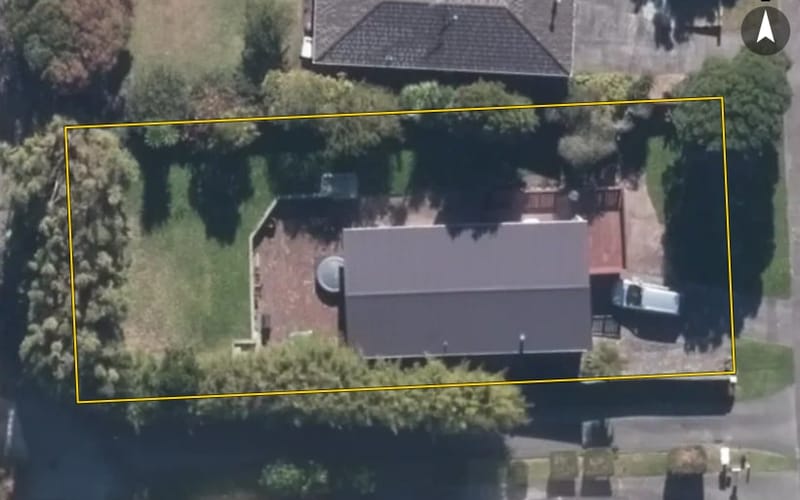
3 Finlow Drive, Te Atatū South
Finlow Drive in Te Atatū South has 37 properties, valued by the council between $530,000 and $1,425,000 with a median of $930,000 (Te Atatū South: $940,000). More of its homes were built in the 1960s than in any other decade. We estimate its homes at a median $861,000. The last sale we have was in December 2024, for $830,000.




The council values Finlow Drive's 37 rated properties between $530,000 and $1,425,000. The middle half sit between about $885,500 and $1,037,500; the median is $930,000 and the mean $958,108.
| Bedrooms | Homes | Median council value | Sold, last 12 months | Median sale |
|---|---|---|---|---|
| 1 | 1 | $530k | 0 | — |
| 2 | 2 | $730k | 0 | — |
| 3 | 23 | $900k | 0 | — |
| 4 | 9 | $1.13m | 0 | — |
| 5+ | 1 | $1.05m | 0 | — |
Council rating valuations: the council's figure for apportioning rates, not a market appraisal.
Finlow Drive's median council value is about the same as Te Atatū South's.
| Finlow Drive | Te Atatū South | Auckland | |
|---|---|---|---|
| Median council value | $930k | $940k | $1.07m |
| Time between sales | 5.9 yrs | 9.1 yrs | 8.9 yrs |
| Median section | 675 m² | 607 m² | 607 m² |
| Median year built | 1970 | 1970 | 1980 |
| Council value per m² of floor | $8k | $7k | $8k |
Median sale price by year; 2024 is the year so far. A year with fewer than two sales has no bar.
| Year | Sales | Median price | Per m² floor |
|---|---|---|---|
| 2024 | 2 | $865,000 | $8,937 |
| 2023 | 2 | $862,500 | $6,989 |
| 2022 | 4 | $1,012,500 | $11,662 |
| 2021 | 4 | $1,165,000 | $9,708 |
| 2020 | 2 | $657,500 | $8,892 |
| 2019 | 3 | $805,000 | $5,057 |
| 2018 | 2 | $695,000 | $7,835 |
| 2017 | 5 | $750,000 | $5,200 |
| 2016 | 2 | $980,000 | $7,362 |
Finlow Drive has 33 houses, 2 units and townhouses and 2 apartments. More were built in the 1960s than in any other decade (46%).
Homes on Finlow Drive that resold in the last five years had been held a median 5.9 years (Te Atatū South: 9.1 years).
Time between a home's sales, for 8 resales in the last five years. A home not sold since our records begin is not counted, so owners who stay longest are under-represented.
Every street in Te Atatū South, and the suburb's house prices and sales.
Sales and valuations as at 11 September 2026, from council and LINZ records. Medians resting on fewer than 3 sales are not shown.