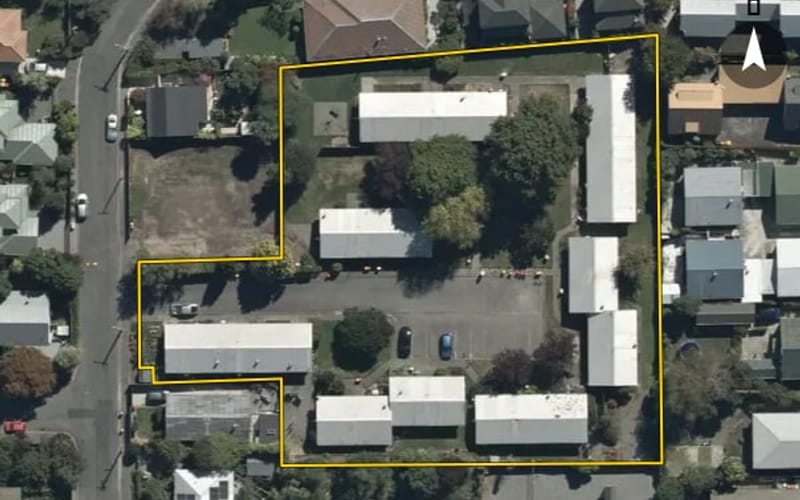
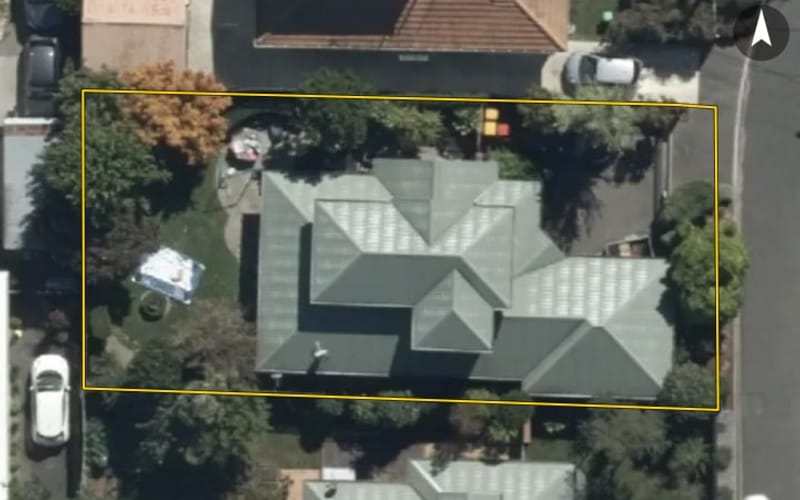
$3,890,000 CV
26 Dover Street, St Albans
Dover Street in St Albans has 75 properties, valued by the council between $370,000 and $3,890,000 with a median of $670,000 (St Albans: $780,000). More of its homes were built in the 1970s than in any other decade.

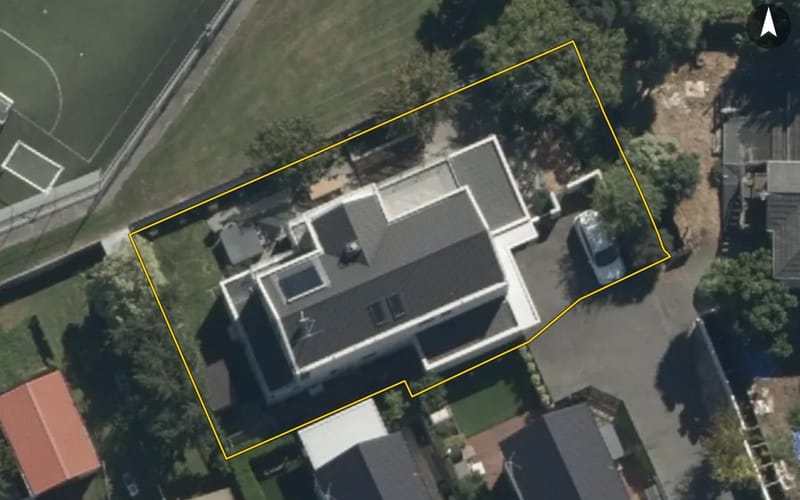


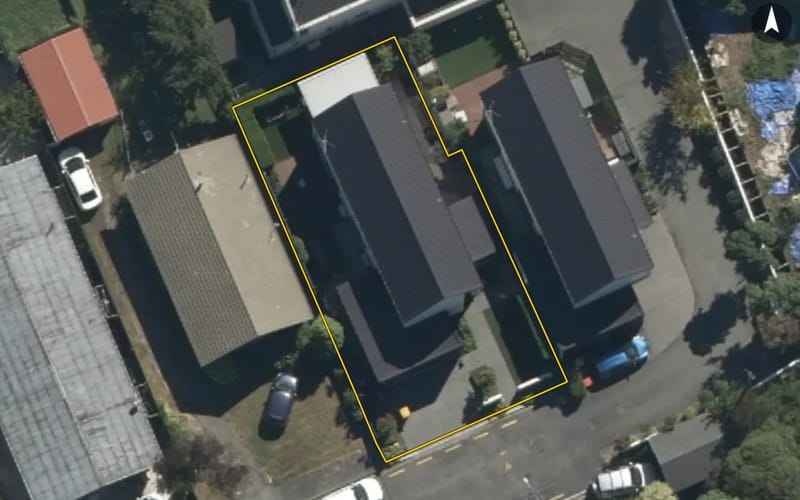

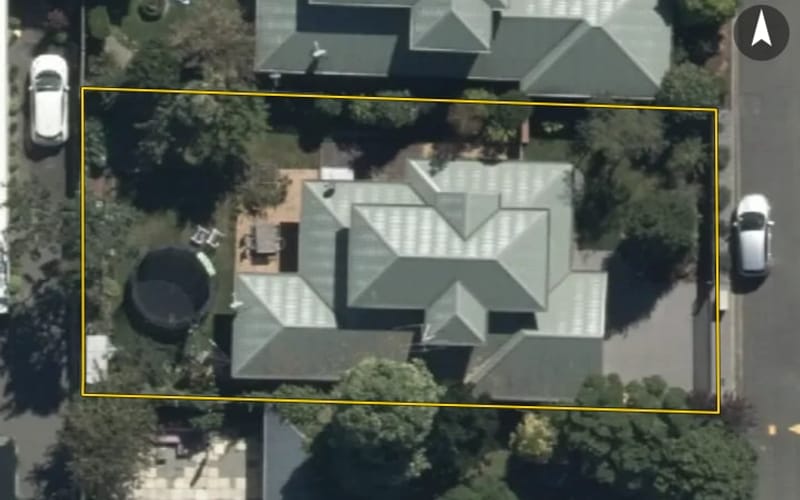





The council values Dover Street's 74 rated properties between $370,000 and $3,890,000. The middle half sit between about $523,000 and $821,000; the median is $670,000 and the mean $738,649.
Council rating valuations: the council's figure for apportioning rates, not a market appraisal.
Dover Street's median council value is 14% below St Albans's.
| Dover Street | St Albans | Christchurch | |
|---|---|---|---|
| Median council value | $670k | $780k | $680k |
| Median section | 365 m² | 554 m² | 625 m² |
| Median year built | 1970 | 1990 | 1980 |
| Council value per m² of floor | $7k | $6k | $5k |
Dover Street has 40 houses, 31 units and townhouses and 3 sections. More were built in the 1970s than in any other decade (23%).
Every street in St Albans, and the suburb's house prices and sales.
Sales and valuations as at 11 September 2026, from council and LINZ records. Medians resting on fewer than 3 sales are not shown.