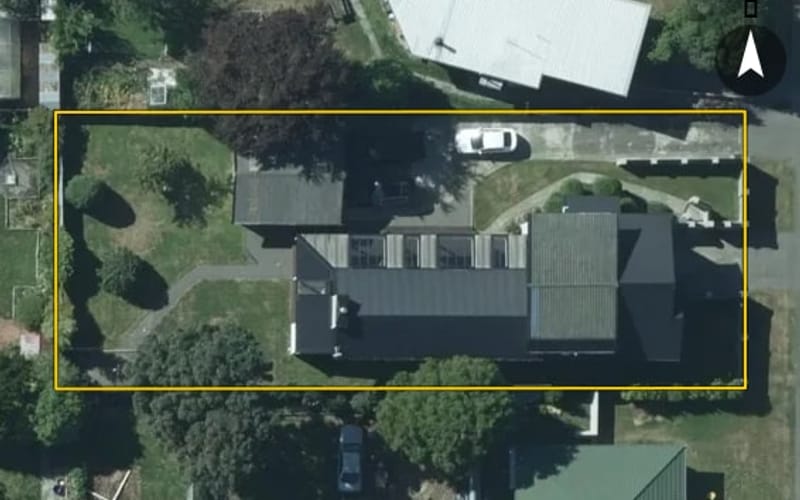
73 properties · Waverley, Invercargill

Ward Street, Waverley

Ward Street in Waverley has 73 properties, valued by the council between $225,000 and $910,000 with a median of $450,000 (Waverley: $520,000). Most of its homes were built in the 1950s. We estimate its homes at a median $556,000. 7 sold in the last twelve months, for a median $544,000. The highest sale in 2026 was 100 Ward Street, at $790,000.
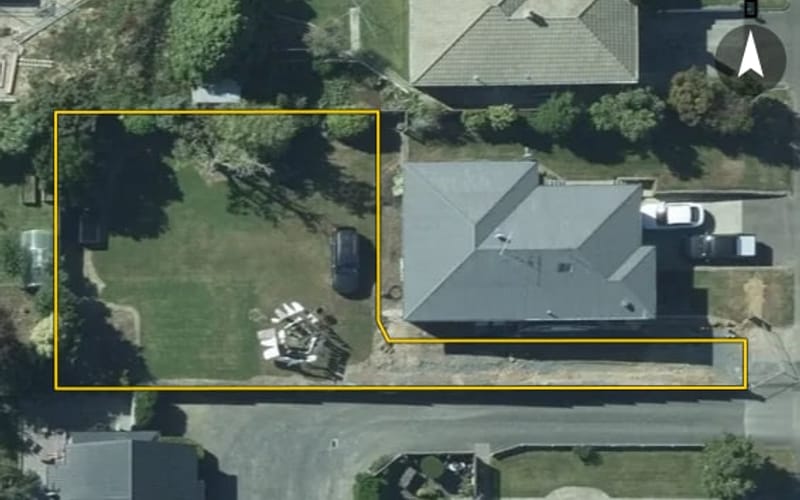
$450kmedian council valuation
$556kour median estimate
$544kmedian sale, last 12 months · 7 sales
1950median year built
InvercargillWaverley ×Ward Street ×

73 properties on Ward Street, Waverley

Highest and lowest on Ward Street

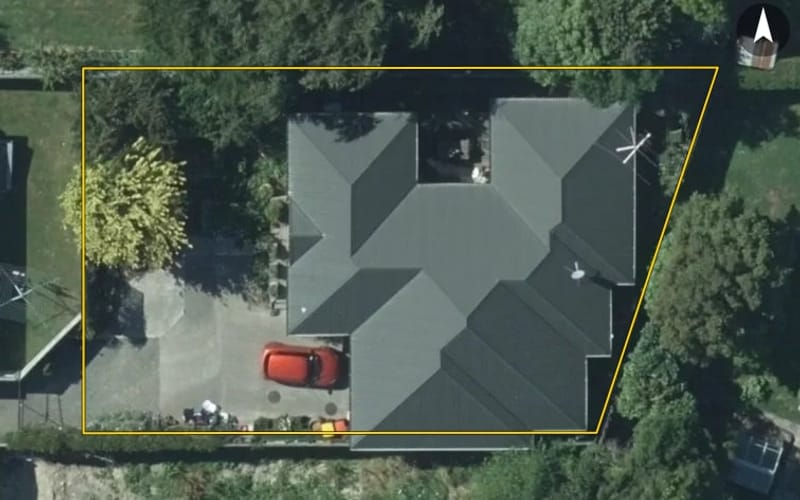
Highest-valued home134 Ward Street$910,000council valuation · 4 bed · 264 m² floor · 1,012 m² land
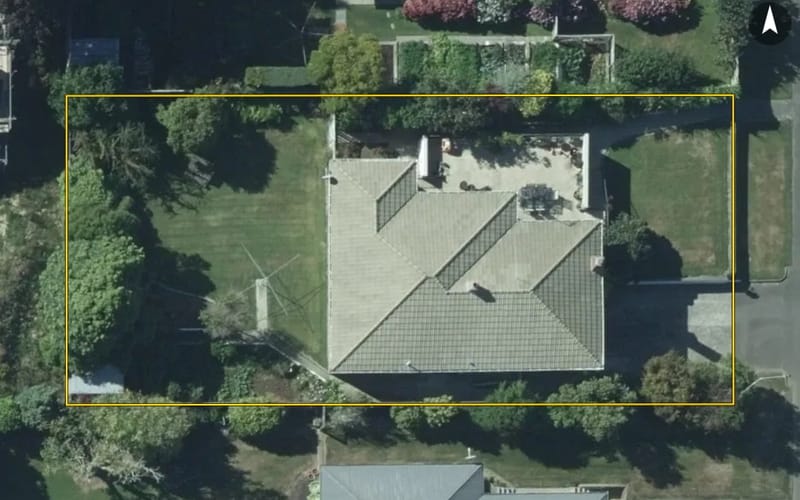
Lowest-valued home61A Ward Street$225,000council valuation · 548 m² land
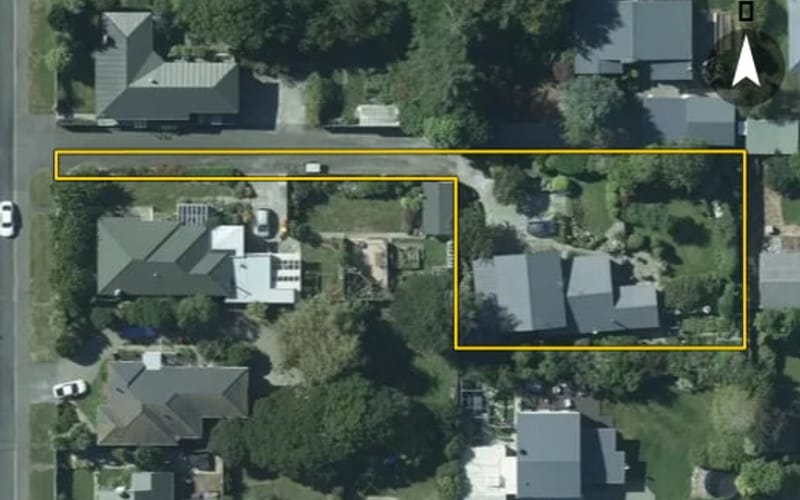
Highest sale in 2026100 Ward Street$790,000sold 13 Jan 2026 · 3 bed · 158 m² floor · 511 m² land

Property values on Ward Street

The council values Ward Street's 69 rated properties between $225,000 and $910,000. The middle half sit between about $398,500 and $574,000; the median is $450,000 and the mean $494,797.

Lowest: $225k$225kLowest10%: $345k20%: $383k20%30%: $414k40%: $430k40%Median: $450k60%: $510k60%70%: $540k80%: $608k80%90%: $704kHighest: $910k$910kHighest
BedroomsHomesMedian council valueSold, last 12 monthsMedian sale
26$345k1—
346$443k4$522k
414$593k2—

Council rating valuations: the council's figure for apportioning rates, not a market appraisal.

Ward Street compared with Waverley

Ward Street's median council value is 13% below Waverley's.

Ward StreetWaverleyInvercargill
Median council value$450k$520k$435k
Median sale, last 12 months$544k$590k$515k
Sold in the last 12 months9.6%6.5%4.8%
Time between sales8.2 yrs6.7 yrs7.2 yrs
Median section731 m²668 m²759 m²
Median year built195019501960
Council value per m² of floor$4k$4k$3k

Ward Street house prices over time

Median sale price by year; 2026 is the year so far. A year with fewer than two sales has no bar.

2016: $159k (4 sales)$159k20162017: $330k (4 sales)2018: $439k (4 sales)20182019: $275k (4 sales)2020: $455k (4 sales)20202021: $459k (5 sales)2022: $363k (2 sales)20222023: $551k (3 sales)2024: $497k (4 sales)20242025: $388k (4 sales)2026: $602k (6 sales, this year so far)$602k2026
Sales by year as a table
YearSalesMedian pricePer m² floor
20266$602,000$4,904
20254$387,500$3,456
20244$497,000$3,787
20233$551,000$4,106
20222$362,500$2,932
20215$459,000$3,932
20204$455,000$2,774
20194$275,000$2,145
20184$438,575$2,246
20174$330,250$1,823
20164$159,000$1,202

Recent sales on Ward Street

  • 1 Ward Street$500,0006 May 2026 · 3 bed · 104 m² floor · 508 m² land
  • 103 Ward Street$544,00028 Mar 2026 · 3 bed · 160 m² floor · 908 m² land
  • 148 Ward Street$660,00015 Mar 2026 · 4 bed · 190 m² floor · 445 m² land
  • 59 Ward Street$460,0001 Mar 2026 · 2 bed · 90 m² floor · 405 m² land
  • 101 Ward Street$720,00023 Feb 2026 · 4 bed · 130 m² floor · 1,204 m² land
  • 100 Ward Street$790,00013 Jan 2026 · 3 bed · 158 m² floor · 511 m² land
  • 60 Ward Street$400,0002 Oct 2025 · 3 bed · 121 m² floor · 791 m² land
  • 151 Ward Street$627,0005 Sept 2025 · 3 bed · 114 m² floor · 503 m² land
  • 140 Ward Street$265,00011 Jul 2025 · 153 m² floor · 526 m² land
  • 25 Ward Street$375,00013 Jun 2025 · 3 bed · 104 m² floor · 713 m² land
  • 9 Ward Street$375,0001 Sept 2024 · 3 bed · 100 m² floor · 1,027 m² land
  • 142 Ward Street$497,0008 Mar 2024 · 3 bed · 130 m² floor · 434 m² land
  • 106 Ward Street$700,0003 Mar 2024 · 3 bed · 190 m² floor · 1,012 m² land
  • 142 Ward Street$497,0003 Mar 2024 · 3 bed · 130 m² floor · 434 m² land
  • 1 Ward Street$427,00027 Nov 2023 · 3 bed · 104 m² floor · 508 m² land
  • 109 Ward Street$745,0005 Oct 2023 · 4 bed · 186 m² floor · 399 m² land
  • 98 Ward Street$551,00020 Mar 2023 · 3 bed · 120 m² floor · 501 m² land
  • 151 Ward Street$265,00023 Dec 2022 · 3 bed · 114 m² floor · 503 m² land
  • 133 Ward Street$460,00024 Jan 2022 · 3 bed · 130 m² floor · 739 m² land
  • 101 Ward Street$600,0009 Oct 2021 · 4 bed · 130 m² floor · 1,204 m² land

The homes on Ward Street

Ward Street has 65 houses, 6 units and townhouses and 1 section. Most were built in the 1950s (64%).

1920s: 2 (2 homes)21940s: 1 (1 home)1940s1950s: 44 (44 homes)441960s: 7 (7 homes)1960s1970s: 4 (4 homes)1980s: 1 (1 home)1980s1990s: 1 (1 home)2000s: 1 (1 home)2000s2010s: 4 (4 homes)2020s: 4 (4 homes)42020s

How long owners stay on Ward Street

Homes on Ward Street that resold in the last five years had been held a median 8.2 years (Waverley: 6.7 years).

Time between a home's sales, for 17 resales in the last five years. A home not sold since our records begin is not counted, so owners who stay longest are under-represented.

Building and resource consents on Ward Street

9building consents in the last 5 years
  • 131 Ward Street1 Jun 2026 · Building consentMinor drainage work - sewer separation
  • 8C Ward Street1 May 2026 · Building consentInternal alterations with insulation, solid fuel burner flue & cladding to external walls
  • 22A Ward Street1 May 2026 · Building consentInternal alterations with insulation & cladding to external walls
  • 140 Ward Street1 Aug 2025 · Building consentRbw construct 3 bdrm dwg with attached gge
  • 22A Ward Street1 Feb 2024 · Building consentFree standing Bosca Firepoint 360 solid fuel heater

Ward Street in other suburbs

Sales and valuations as at 11 September 2026, from council and LINZ records. Medians resting on fewer than 3 sales are not shown.