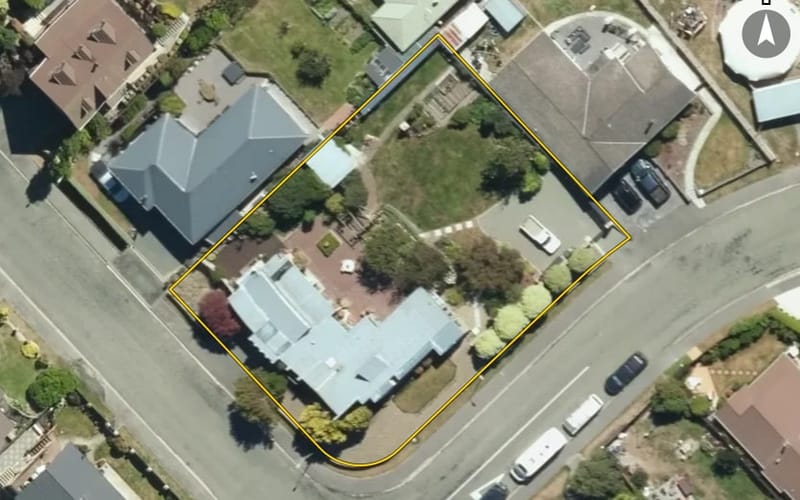
41 properties · South Hill, Oamaru

Leven Street, South Hill

Leven Street in South Hill has 41 properties, valued by the council between $360,000 and $950,000 with a median of $625,000 (South Hill: $445,000). More of its homes were built in the 1980s than in any other decade. We estimate its homes at a median $638,000. 2 sold in the last twelve months. The highest sale in 2026 was 11 Leven Street, at $779,000.

$625kmedian council valuation
$638kour median estimate
2sold in the last 12 months
1980median year built
OamaruSouth Hill ×Leven Street ×

42 properties on Leven Street, South Hill

Highest and lowest on Leven Street

Highest-valued home11 Leven Street$950,000council valuation · 4 bed · 316 m² floor · 1,214 m² land
Lowest-valued home14 Leven Street$360,000council valuation · 2 bed · 70 m² floor
Highest sale in 202611 Leven Street$779,000sold 9 Mar 2026 · 4 bed · 316 m² floor · 1,214 m² land

Property values on Leven Street

The council values Leven Street's 34 rated properties between $360,000 and $950,000. The middle half sit between about $578,000 and $707,000; the median is $625,000 and the mean $641,912.

Lowest: $360k$360kLowest10%: $497k20%: $566k20%30%: $590k40%: $600k40%Median: $625k60%: $648k60%70%: $670k80%: $744k80%90%: $836kHighest: $950k$950kHighest
BedroomsHomesMedian council valueSold, last 12 monthsMedian sale
22$465k0—
314$600k1—
417$660k1—
5+1$900k0—

Council rating valuations: the council's figure for apportioning rates, not a market appraisal.

Leven Street compared with South Hill

Leven Street's median council value is 40% above South Hill's.

Leven StreetSouth HillOamaru
Median council value$625k$445k$445k
Sold in the last 12 months4.9%3.8%4%
Time between sales8.3 yrs6.9 yrs7.4 yrs
Median section666 m²759 m²860 m²
Median year built198019401960
Council value per m² of floor$3k$3k$3k

Leven Street house prices over time

Median sale price by year; 2026 is the year so far. A year with fewer than two sales has no bar.

2016: $388k (2 sales)$388k2017: too few sales to say (1 sale)20172018: too few sales to say (1 sale)2019: $426k (2 sales)20192020: $405k (3 sales)2021: $586k (2 sales)20212022: too few sales to say (1 sale)2024: $650k (5 sales)20242025: $625k (2 sales)2026: $754k (2 sales, this year so far)$754k2026
Sales by year as a table
YearSalesMedian pricePer m² floor
20262$753,500$2,887
20252$625,000$3,107
20245$650,000$2,984
20221$670,000$2,792
20212$586,000$2,563
20203$404,500$2,341
20192$426,000$1,860
20181$308,000$2,369
20171$580,000$1,933
20162$388,000$1,742

Recent sales on Leven Street

  • 15 Leven Street$728,00013 Jul 2026 · 3 bed · 220 m² floor · 662 m² land
  • 11 Leven Street$779,0009 Mar 2026 · 4 bed · 316 m² floor · 1,214 m² land
  • 23 Leven Street$692,00011 Apr 2025 · 3 bed · 360 m² floor · 663 m² land
  • 28 Leven Street$558,00017 Feb 2025 · 3 bed · 130 m² floor · 667 m² land
  • 4 Leven Street$659,0002 Dec 2024 · 4 bed · 137 m² floor · 809 m² land
  • 30 Leven Street$525,0005 Oct 2024 · 4 bed · 270 m² floor · 703 m² land
  • 33 Leven Street$567,00018 Sept 2024 · 3 bed · 190 m² floor · 603 m² land
  • 3 Leven Street$690,00031 May 2024 · 4 bed · 197 m² floor · 609 m² land
  • 21 Leven Street$650,0007 Feb 2024 · 3 bed · 250 m² floor · 663 m² land
  • 40 Leven Street$670,00020 Feb 2022 · 3 bed · 240 m² floor · 638 m² land
  • 15 Leven Street$642,00013 Jul 2021 · 3 bed · 220 m² floor · 662 m² land
  • 34 Leven Street$530,00026 Jan 2021 · 4 bed · 240 m² floor · 665 m² land
  • 15 Leven Street$515,00023 Nov 2020 · 3 bed · 220 m² floor · 662 m² land
  • 14 Leven Street$315,00011 Aug 2020 · 2 bed · 70 m² floor
  • 33 Leven Street$404,50018 Jun 2020 · 3 bed · 190 m² floor · 603 m² land
  • 30 Leven Street$417,0008 Jul 2019 · 4 bed · 270 m² floor · 703 m² land
  • 32 Leven Street$435,00028 Apr 2019 · 4 bed · 200 m² floor · 630 m² land
  • 22 Leven Street$308,00018 May 2018 · 2 bed · 130 m² floor · 666 m² land
  • 18A Leven Street$580,00013 Jan 2017 · 5 bed · 300 m² floor · 11,582 m² land
  • 17 Leven Street$389,00016 Dec 2016 · 4 bed · 201 m² floor · 662 m² land

The homes on Leven Street

Leven Street has 35 houses and 6 units and townhouses. More were built in the 1980s than in any other decade (41%).

1970s: 7 (7 homes)71970s1980s: 14 (14 homes)141980s1990s: 6 (6 homes)1990s2000s: 4 (4 homes)2000s2010s: 3 (3 homes)32010s

How long owners stay on Leven Street

Homes on Leven Street that resold in the last five years had been held a median 8.3 years (South Hill: 6.9 years).

Time between a home's sales, for 10 resales in the last five years. A home not sold since our records begin is not counted, so owners who stay longest are under-represented.

Building and resource consents on Leven Street

2building consents in the last 5 years
  • 18B Leven Street1 Sept 2024 · Building consentPlumbing & drainage for ensuite
  • 34 Leven Street1 Mar 2022 · Building consentInstallation of a free-standing masport hesita 2 woodburner &

Sales and valuations as at 11 September 2026, from council and LINZ records. Medians resting on fewer than 3 sales are not shown.