21 properties · Bunnythorpe, Palmerston North

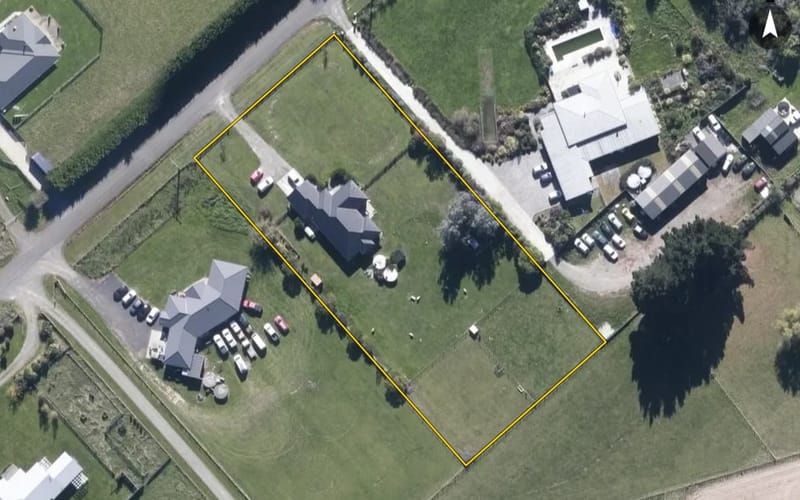
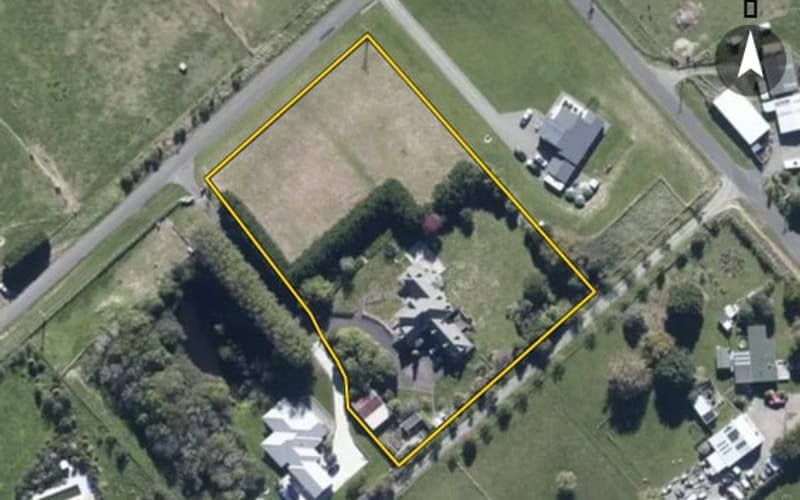
Clevely Line, Bunnythorpe

Clevely Line in Bunnythorpe has 21 properties, valued by the council between $370,000 and $1,990,000 with a median of $1,080,000 (Bunnythorpe: $830,000). More of its homes were built in the 2010s than in any other decade. We estimate its homes at a median $1,050,000. 1 sold in the last twelve months. The highest sale in 2026 was 101 Clevely Line, at $505,000.
$1.08mmedian council valuation
$1.05mour median estimate
1sold in the last 12 months
2000median year built
Palmerston NorthBunnythorpe ×Clevely Line ×

21 properties on Clevely Line, Bunnythorpe

Highest and lowest on Clevely Line

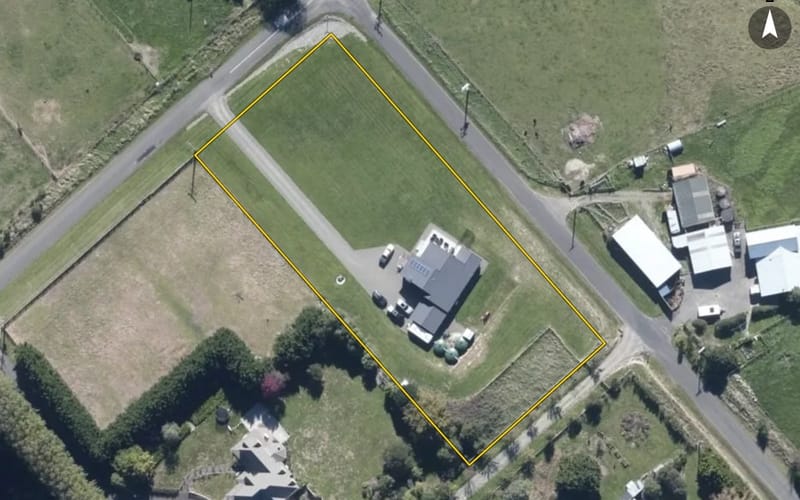
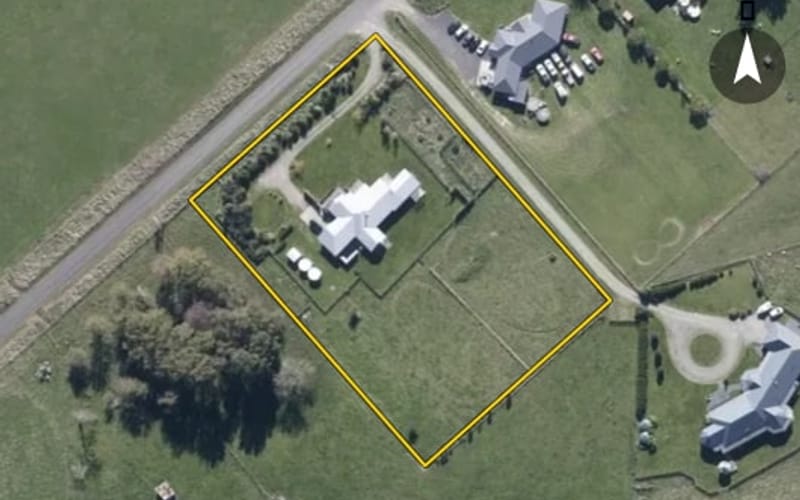
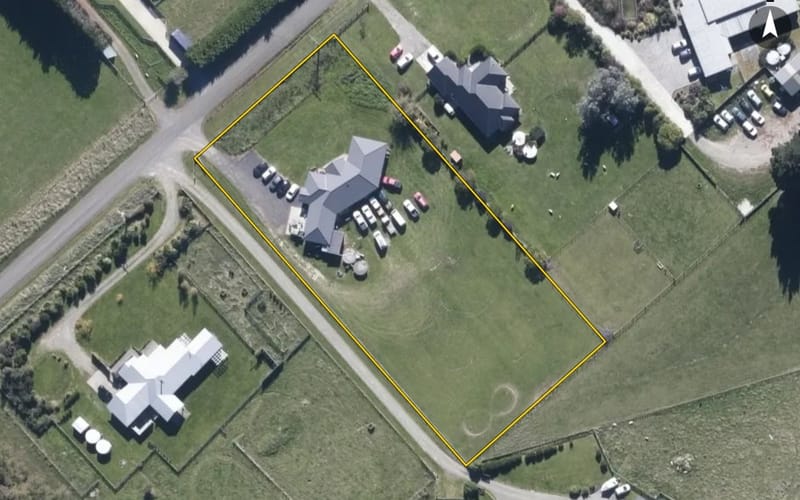
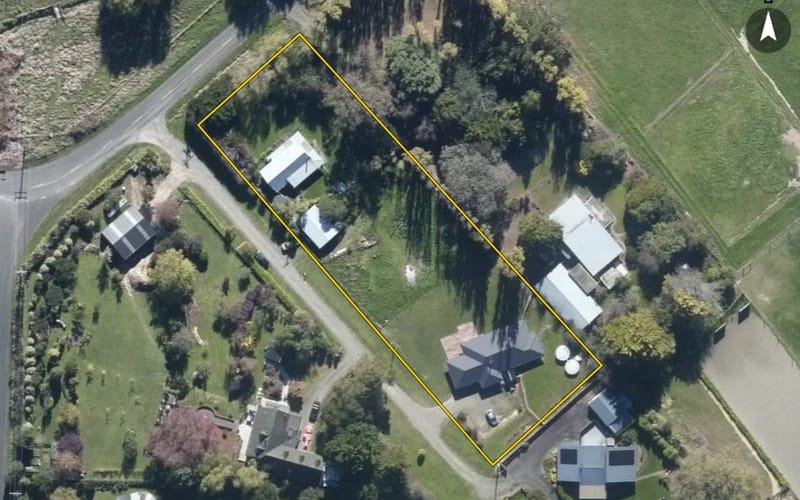
Highest-valued home107 Clevely Line$1,990,000council valuation · 5 bed · 448 m² floor · 7,792 m² land
Lowest-valued home41 Clevely Line$370,000council valuation · 2,352 m² land
Highest sale in 2026101 Clevely Line$505,000sold 26 Mar 2026 · 4 bed · 231 m² floor · 5,322 m² land

Property values on Clevely Line

The council values Clevely Line's 21 rated properties between $370,000 and $1,990,000. The middle half sit between about $807,500 and $1,230,000; the median is $1,080,000 and the mean $1,054,524.

Lowest: $370k$370kLowest10%: $670k20%: $765k20%30%: $850k40%: $950k40%Median: $1.08m60%: $1.13m60%70%: $1.22m80%: $1.24m80%90%: $1.49mHighest: $1.99m$1.99mHighest
BedroomsHomesMedian council valueSold, last 12 monthsMedian sale
34$765k0—
411$1.12m1—
5+5$1.49m0—

Council rating valuations: the council's figure for apportioning rates, not a market appraisal.

Clevely Line compared with Bunnythorpe

Clevely Line's median council value is 30% above Bunnythorpe's.

Clevely LineBunnythorpePalmerston North
Median council value$1.08m$830k$610k
Sold in the last 12 months4.8%2.9%4%
Median section6,069 m²7,972 m²677 m²
Median year built200019801970
Council value per m² of floor$4k$5k$4k

Clevely Line house prices over time

Median sale price by year; 2026 is the year so far. A year with fewer than two sales has no bar.

2016: $354k (5 sales)$354k20162017: $558k (2 sales)20172019: too few sales to say (1 sale)20192020: $808k (2 sales)20202021: $1.19m (4 sales)20212022: $1.56m (4 sales)$1.56m20222026: too few sales to say (1 sale, this year so far)2026
Sales by year as a table
YearSalesMedian pricePer m² floor
20261$505,000$2,186
20224$1,562,500$4,219
20214$1,192,500$5,012
20202$807,500$2,411
20191$925,000$3,339
20172$557,500$1,266
20165$354,000$1,686

Recent sales on Clevely Line

  • 101 Clevely Line$505,00026 Mar 2026 · 4 bed · 231 m² floor · 5,322 m² land
  • 2 Clevely Line$680,00020 Oct 2022 · 3 bed · 210 m² floor · 1,663 m² land
  • 117 Clevely Line$1,510,00010 Oct 2022 · 5 bed · 471 m² floor · 7,998 m² land
  • 107 Clevely Line$2,330,00021 Apr 2022 · 5 bed · 448 m² floor · 7,792 m² land
  • 105 Clevely Line$1,615,00029 Mar 2022 · 4 bed · 296 m² floor · 8,048 m² land
  • 163 Clevely Line$1,285,00027 Jul 2021 · 3 bed · 150 m² floor · 32,951 m² land
  • 121 Clevely Line$1,330,00024 Jun 2021 · 4 bed · 277 m² floor · 8,002 m² land
  • 115 Clevely Line$1,100,0009 Jun 2021 · 6 bed · 271 m² floor · 5,497 m² land
  • 106 Clevely Line$940,0007 May 2021 · 4 bed · 180 m² floor · 26,658 m² land
  • 10 Clevely Line$755,00024 Jul 2020 · 4 bed · 252 m² floor · 8,092 m² land
  • 117 Clevely Line$860,00025 Jan 2020 · 5 bed · 471 m² floor · 7,998 m² land
  • 121 Clevely Line$925,00016 Nov 2019 · 4 bed · 277 m² floor · 8,002 m² land
  • 103 Clevely Line$925,00031 Dec 2017 · 5 bed · 505 m² floor · 8,314 m² land
  • 115 Clevely Line$190,00015 Aug 2017 · 6 bed · 271 m² floor · 5,497 m² land
  • 39A Clevely Line$332,50014 Dec 2016 · 4 bed · 272 m² floor · 4,047 m² land
  • 6 Clevely Line$390,00011 Jun 2016 · 4 bed · 180 m² floor · 2,023 m² land
  • 2 Clevely Line$354,00014 Mar 2016 · 3 bed · 210 m² floor · 1,663 m² land
  • 118 Clevely Line$589,00019 Feb 2016 · 4 bed · 223 m² floor · 13,822 m² land
  • 121 Clevely Line$220,0003 Feb 2016 · 4 bed · 277 m² floor · 8,002 m² land
  • 111 Clevely Line$170,0003 Mar 2015 · 4 bed · 236 m² floor · 5,497 m² land

The homes on Clevely Line

Clevely Line has 21 houses. More were built in the 2010s than in any other decade (40%).

1950s: 1 (1 home)11950s1960s: 1 (1 home)1960s1970s: 1 (1 home)1970s1980s: 5 (5 homes)1980s1990s: 1 (1 home)1990s2000s: 2 (2 homes)2000s2010s: 8 (8 homes)82010s2020s: 1 (1 home)12020s

Building and resource consents on Clevely Line

1building consents in the last 5 years
  • 41 Clevely Line1 Oct 2023 · Building consentTotalspan 10.5m x 9m x 3m shed

Sales and valuations as at 11 September 2026, from council and LINZ records. Medians resting on fewer than 3 sales are not shown.