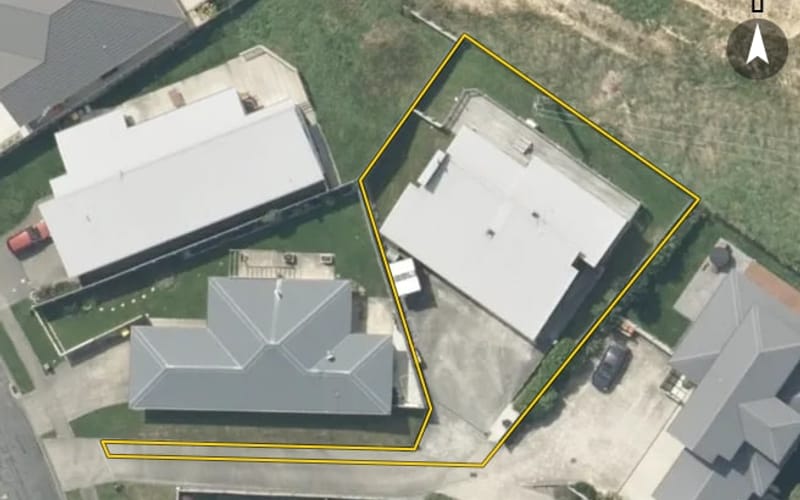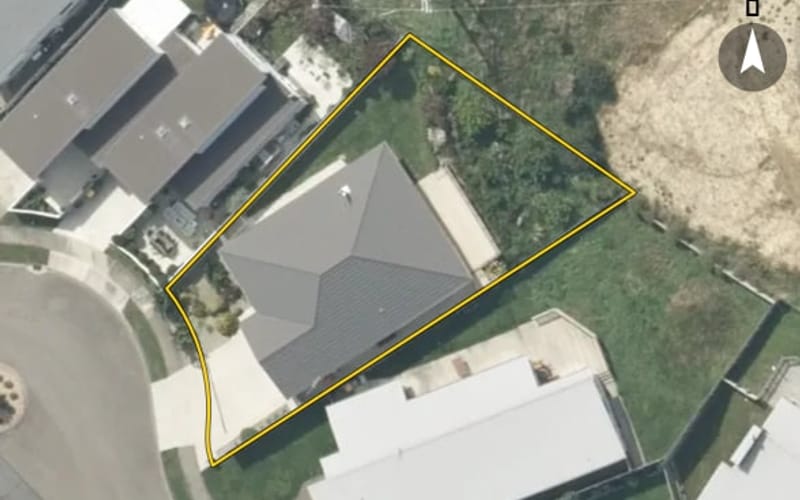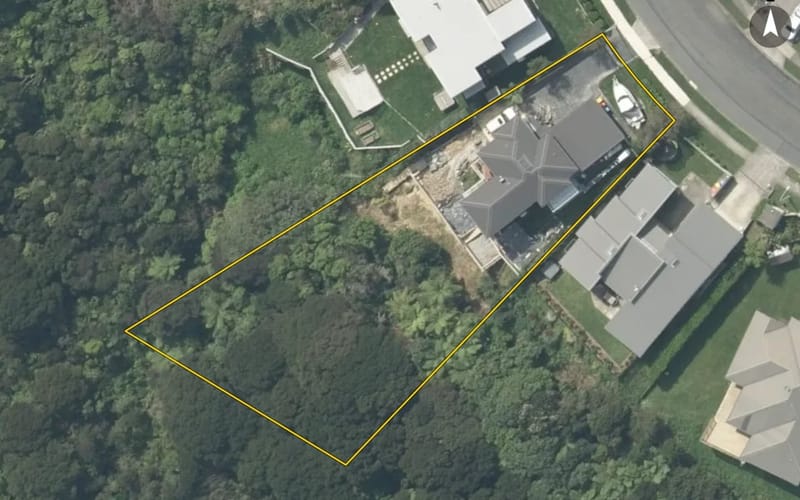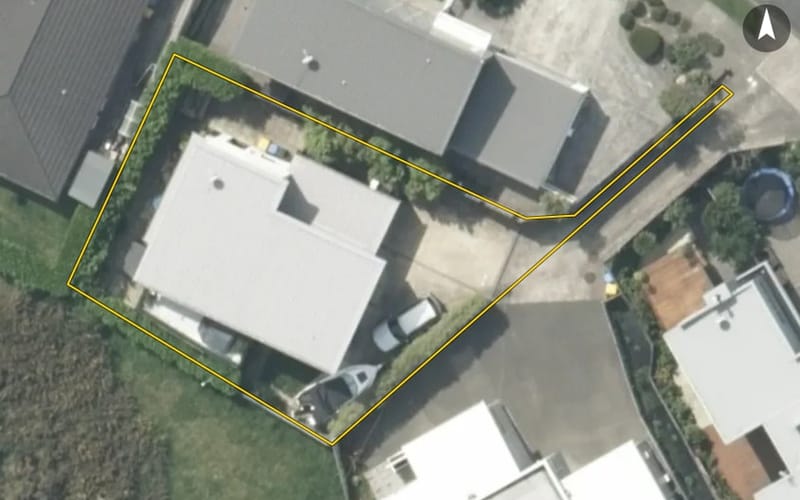
45 properties · Camborne, Porirua

Mo Street, Camborne

Mo Street in Camborne has 45 properties, valued by the council between $420,000 and $1,590,000 with a median of $1,090,000 (Camborne: $890,000). Most of its homes were built in the 2010s. We estimate its homes at a median $1,080,000. The last sale we have was in March 2025, for $1,050,000.

$1.09mmedian council valuation
$1.08mour median estimate
2010median year built
PoriruaCamborne ×Mo Street ×

45 properties on Mo Street, Camborne

Highest and lowest on Mo Street

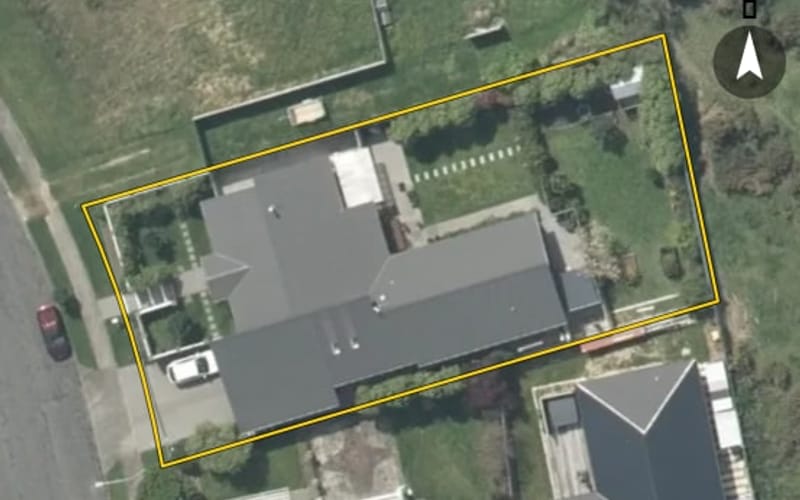
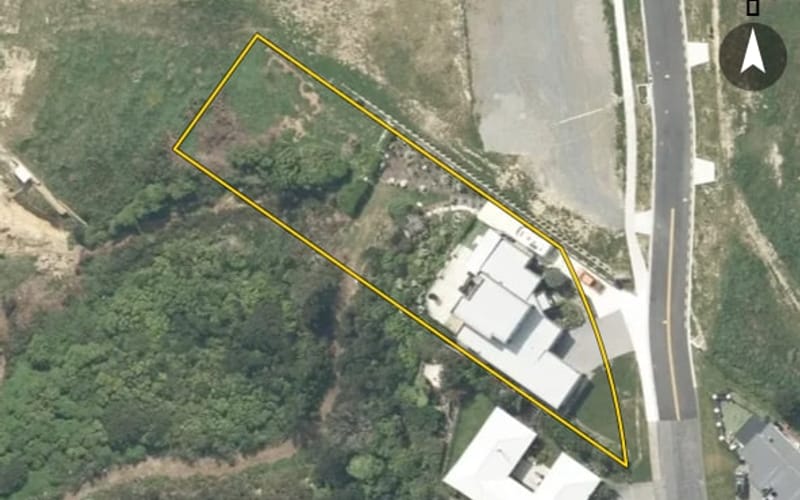
Highest-valued home29 Mo Street$1,590,000council valuation · 4 bed · 310 m² floor · 1,842 m² land
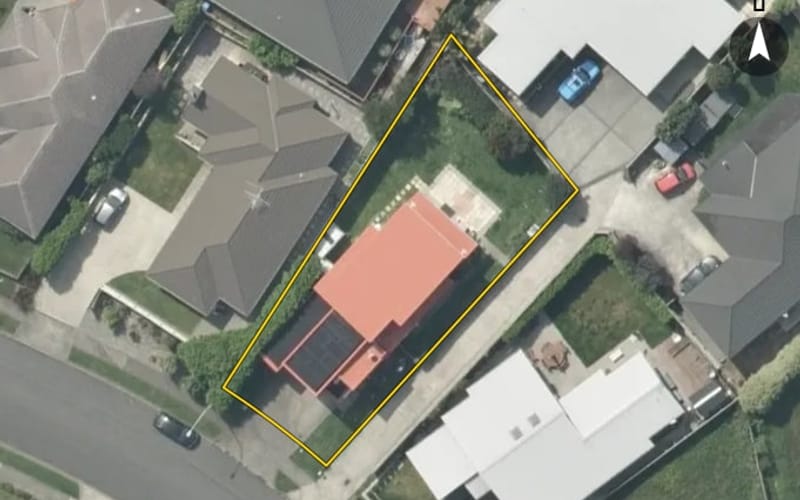
Lowest-valued home20 Mo Street$420,000council valuation · 884 m² land

Property values on Mo Street

The council values Mo Street's 45 rated properties between $420,000 and $1,590,000. The middle half sit between about $1,024,000 and $1,194,000; the median is $1,090,000 and the mean $1,090,000.

Lowest: $420k$420kLowest10%: $820k20%: $1.01m20%30%: $1.04m40%: $1.06m40%Median: $1.09m60%: $1.11m60%70%: $1.17m80%: $1.22m80%90%: $1.33mHighest: $1.59m$1.59mHighest
BedroomsHomesMedian council valueSold, last 12 monthsMedian sale
35$820k0—
435$1.1m0—
5+2$1.25m0—

Council rating valuations: the council's figure for apportioning rates, not a market appraisal.

Mo Street compared with Camborne

Mo Street's median council value is 22% above Camborne's.

Mo StreetCambornePorirua
Median council value$1.09m$890k$770k
Time between sales8.8 yrs10.1 yrs8.9 yrs
Median section656 m²632 m²659 m²
Median year built201019801970
Council value per m² of floor$5k$4k$5k

Mo Street house prices over time

Median sale price by year; 2025 is the year so far. A year with fewer than two sales has no bar.

2016: $655k (8 sales)$655k20162018: $621k (5 sales)2019: $1.13m (5 sales)20192020: $1.03m (4 sales)2021: $1.28m (3 sales)20212022: $1.43m (2 sales)$1.43m2023: $1.26m (5 sales)20232024: $1.1m (2 sales)2025: $1.25m (2 sales, this year so far)$1.25m2025
Sales by year as a table
YearSalesMedian pricePer m² floor
20252$1,250,000$5,529
20242$1,105,000$5,298
20235$1,260,000$5,221
20222$1,427,500$6,337
20213$1,285,000$6,598
20204$1,027,500$4,687
20195$1,130,000$4,428
20185$621,000$4,006
20168$655,000$3,542

Recent sales on Mo Street

  • 44 Mo Street$1,050,00016 Mar 2025 · 4 bed · 216 m² floor · 732 m² land
  • 17 Mo Street$1,450,0009 Jan 2025 · 4 bed · 234 m² floor · 2,445 m² land
  • 12 Mo Street$1,060,0005 Jul 2024 · 4 bed · 202 m² floor · 703 m² land
  • 42 Mo Street$1,150,00019 Mar 2024 · 4 bed · 215 m² floor · 634 m² land
  • 2 Mo Street$1,230,00014 Dec 2023 · 5 bed · 270 m² floor · 664 m² land
  • 3 Mo Street$1,050,0006 Oct 2023 · 4 bed · 182 m² floor · 440 m² land
  • 13 Mo Street$1,320,00018 Aug 2023 · 4 bed · 243 m² floor · 1,369 m² land
  • 8 Mo Street$1,260,00014 Jun 2023 · 4 bed · 242 m² floor · 931 m² land
  • 46 Mo Street$1,300,00026 May 2023 · 4 bed · 249 m² floor · 795 m² land
  • 13 Mo Street$1,425,0002 Jul 2022 · 4 bed · 243 m² floor · 1,369 m² land
  • 38 Mo Street$1,430,00019 Apr 2022 · 4 bed · 210 m² floor · 586 m² land
  • 56A Mo Street$1,108,5005 Nov 2021 · 3 bed · 168 m² floor · 303 m² land
  • 54 Mo Street$1,357,0003 Sept 2021 · 3 bed · 195 m² floor · 611 m² land
  • 3A Mo Street$1,285,0002 Sept 2021 · 4 bed · 231 m² floor · 469 m² land
  • 14 Mo Street$360,00012 May 2020 · 4 bed · 220 m² floor · 656 m² land
  • 40 Mo Street$1,100,00027 Feb 2020 · 4 bed · 238 m² floor · 599 m² land
  • 48 Mo Street$955,00027 Feb 2020 · 4 bed · 201 m² floor · 707 m² land
  • 27 Mo Street$1,600,00013 Feb 2020 · 4 bed · 270 m² floor · 2,175 m² land
  • 15 Mo Street$1,130,00024 Sept 2019 · 4 bed · 227 m² floor · 1,651 m² land
  • 52 Mo Street$925,00019 Jul 2019 · 4 bed · 226 m² floor · 750 m² land

The homes on Mo Street

Mo Street has 42 houses and 3 sections. Most were built in the 2010s (74%).

2000s: 9 (9 homes)92000s2010s: 31 (31 homes)312010s2020s: 2 (2 homes)22020s

How long owners stay on Mo Street

Homes on Mo Street that resold in the last five years had been held a median 8.8 years (Camborne: 10.1 years).

Time between a home's sales, for 12 resales in the last five years. A home not sold since our records begin is not counted, so owners who stay longest are under-represented.

Building and resource consents on Mo Street

2building consents in the last 5 years
1resource consents in the last 5 years
  • 15 Mo Street1 May 2024 · Building consentUnderpinning deck support columns. Timber pole retaining walls
  • 54 Mo Street1 Mar 2022 · Building consentInstallation of a new masport r3000
  • 15 Mo Street9 Jul 2024 · Resource consentS221 (3) (a) request for Cancellation of existing consent notice condition to remove vegetation in order to install retaining wall

Mo Street in other suburbs

Sales and valuations as at 11 September 2026, from council and LINZ records. Medians resting on fewer than 3 sales are not shown.