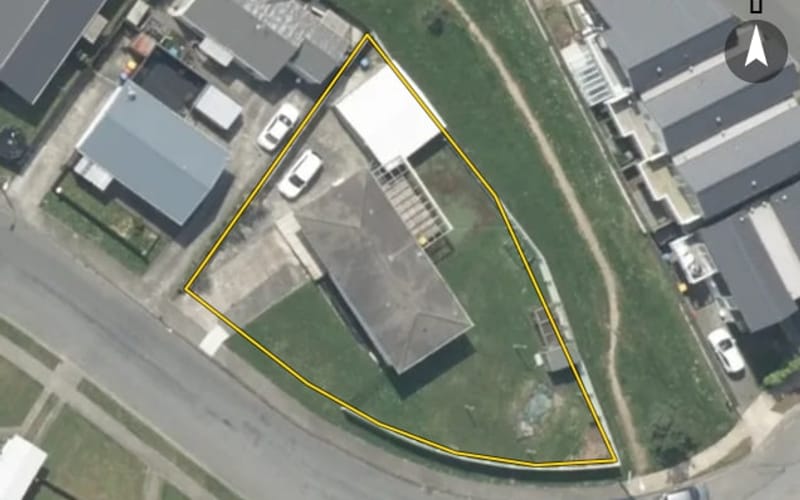
42 properties · Whitby, Porirua

Cleat Street, Whitby

Cleat Street in Whitby has 42 properties, valued by the council between $610,000 and $2,580,000 with a median of $730,000 (Whitby: $910,000). Most of its homes were built in the 1980s. We estimate its homes at a median $698,000. 3 sold in the last twelve months, for a median $740,000. The highest sale in 2026 was 35 Cleat Street, at $826,000.

$730kmedian council valuation
$698kour median estimate
$740kmedian sale, last 12 months · 3 sales
1980median year built
PoriruaWhitby ×Cleat Street ×

42 properties on Cleat Street, Whitby

Highest and lowest on Cleat Street

Highest-valued home51 Cleat Street$2,580,000council valuation · 5 bed · 767 m² floor · 3.2 ha land
Lowest-valued home43A Cleat Street$610,000council valuation · 3 bed · 84 m² floor · 224 m² land
Highest sale in 202635 Cleat Street$826,000sold 17 Jun 2026 · 4 bed · 166 m² floor · 825 m² land

Property values on Cleat Street

The council values Cleat Street's 41 rated properties between $610,000 and $2,580,000. The middle half sit between about $695,000 and $800,000; the median is $730,000 and the mean $797,561.

Lowest: $610k$610kLowest10%: $650k20%: $680k20%30%: $710k40%: $710k40%Median: $730k60%: $750k60%70%: $790k80%: $810k80%90%: $830kHighest: $2.58m$2.58mHighest
BedroomsHomesMedian council valueSold, last 12 monthsMedian sale
329$710k2—
49$820k1—
5+3$1.22m0—

Council rating valuations: the council's figure for apportioning rates, not a market appraisal.

Cleat Street compared with Whitby

Cleat Street's median council value is 20% below Whitby's.

Cleat StreetWhitbyPorirua
Median council value$730k$910k$760k
Median sale, last 12 months$740k$885k$826k
Sold in the last 12 months7.1%4.7%3.1%
Time between sales11.0 yrs8.5 yrs8.9 yrs
Median section701 m²636 m²660 m²
Median year built198019901970
Council value per m² of floor$7k$5k$5k

Cleat Street house prices over time

Median sale price by year; 2026 is the year so far. A year with fewer than two sales has no bar.

2016: $406k (4 sales)$406k2017: $689k (2 sales)20172018: $608k (3 sales)2019: $565k (3 sales)20192020: $706k (2 sales)2022: too few sales to say (1 sale)20222023: too few sales to say (1 sale)2024: $730k (3 sales)$730k20242025: $710k (3 sales)$710k2026: too few sales to say (1 sale, this year so far)2026
Sales by year as a table
YearSalesMedian pricePer m² floor
20261$826,000$4,976
20253$710,000$7,011
20243$730,000$6,792
20231$595,000$8,264
20221$835,000$8,107
20202$706,000$5,447
20193$565,000$3,870
20183$607,500$6,042
20172$689,000$6,901
20164$406,000$3,260

Recent sales on Cleat Street

  • 35 Cleat Street$826,00017 Jun 2026 · 4 bed · 166 m² floor · 825 m² land
  • 41 Cleat Street$740,0003 Nov 2025 · 3 bed · 103 m² floor · 540 m² land
  • 20 Cleat Street$631,00021 Oct 2025 · 3 bed · 90 m² floor · 1,319 m² land
  • 11 Cleat Street$710,00017 Jun 2025 · 3 bed · 130 m² floor · 605 m² land
  • 47 Cleat Street$720,00026 Nov 2024 · 3 bed · 106 m² floor · 139 m² land
  • 6 Cleat Street$825,00029 Aug 2024 · 4 bed · 150 m² floor · 610 m² land
  • 3 Cleat Street$730,00028 May 2024 · 3 bed · 93 m² floor · 501 m² land
  • 43 Cleat Street$595,0008 Mar 2023 · 3 bed · 72 m² floor · 301 m² land
  • 41 Cleat Street$835,00016 Feb 2022 · 3 bed · 103 m² floor · 540 m² land
  • 33 Cleat Street$762,0004 Jul 2020 · 3 bed · 160 m² floor · 737 m² land
  • 47 Cleat Street$650,0005 Feb 2020 · 3 bed · 106 m² floor · 139 m² land
  • 17 Cleat Street$535,00019 Jun 2019 · 3 bed · 85 m² floor · 532 m² land
  • 9 Cleat Street$565,00017 May 2019 · 3 bed · 146 m² floor · 701 m² land
  • 4 Cleat Street$655,00024 Jan 2019 · 4 bed · 180 m² floor · 504 m² land
  • 10 Cleat Street$607,50023 Aug 2018 · 3 bed · 133 m² floor · 705 m² land
  • 47 Cleat Street$950,00014 Jun 2018 · 3 bed · 106 m² floor · 139 m² land
  • 43 Cleat Street$435,00021 Apr 2018 · 3 bed · 72 m² floor · 301 m² land
  • 47 Cleat Street$900,00016 Oct 2017 · 3 bed · 106 m² floor · 139 m² land
  • 24 Cleat Street$478,00031 Aug 2017 · 3 bed · 90 m² floor · 1,260 m² land
  • 53 Cleat Street$825,00010 Aug 2016 · 5 bed · 359 m² floor · 1,519 m² land

The homes on Cleat Street

Cleat Street has 42 houses. Most were built in the 1980s (54%).

1970s: 13 (13 homes)131970s1980s: 22 (22 homes)221980s1990s: 2 (2 homes)1990s2000s: 2 (2 homes)2000s2010s: 1 (1 home)2010s2020s: 1 (1 home)12020s

How long owners stay on Cleat Street

Homes on Cleat Street that resold in the last five years had been held a median 11.0 years (Whitby: 8.5 years).

Time between a home's sales, for 9 resales in the last five years. A home not sold since our records begin is not counted, so owners who stay longest are under-represented.

Building and resource consents on Cleat Street

3building consents in the last 5 years
3resource consents in the last 5 years
  • 53 Cleat Street1 Dec 2024 · Building consentReconfigure existing toilet into a new accessible bathrm
  • 7 Cleat Street1 Apr 2023 · Building consentAmendment 1 - deck replacement structure - a revised structure of timber deck & access & remedial external framing within the footprint of the original consent.
  • 7 Cleat Street1 Nov 2021 · Building consentDeck replacement - deck to first floor level with steps for access.
  • 53 Cleat Street21 May 2024 · Resource consentTo build a new storage shed on the described site with earthworks and retaining to enable access
  • 53 Cleat Street1 Nov 2023 · Resource consentNew shed that encroaches into a Significant Natural Area (SNA)
  • 39 Cleat Street26 Jun 2023 · Resource consentEstablish a new Montessori school

Sales and valuations as at 11 September 2026, from council and LINZ records. Medians resting on fewer than 3 sales are not shown.