62 properties · Wanganui East, Whanganui

No 3 Line, Wanganui East

No 3 Line in Wanganui East has 62 properties, valued by the council between $265,000 and $1,625,000 with a median of $595,000 (Wanganui East: $435,000). More of its homes were built in the 1970s than in any other decade. We estimate its homes at a median $608,500. 2 sold in the last twelve months. The highest sale in 2026 was 157 No 3 Line, at $690,000.

$595kmedian council valuation
$609kour median estimate
2sold in the last 12 months
1970median year built
WhanganuiWanganui East ×No 3 Line ×

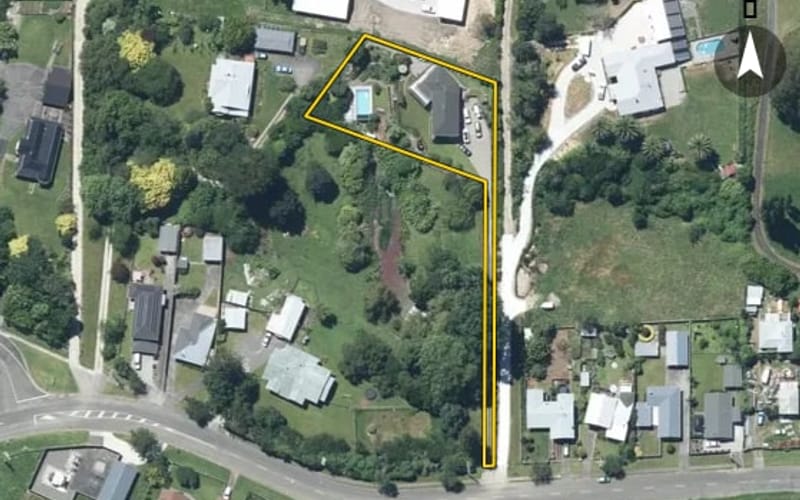
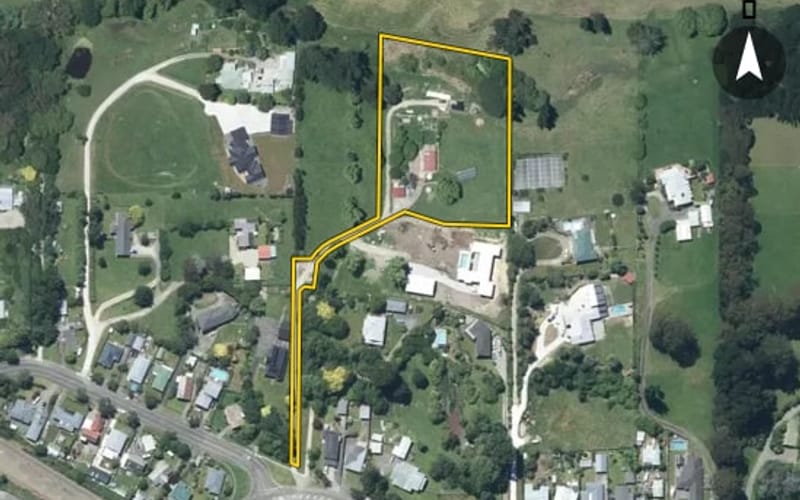
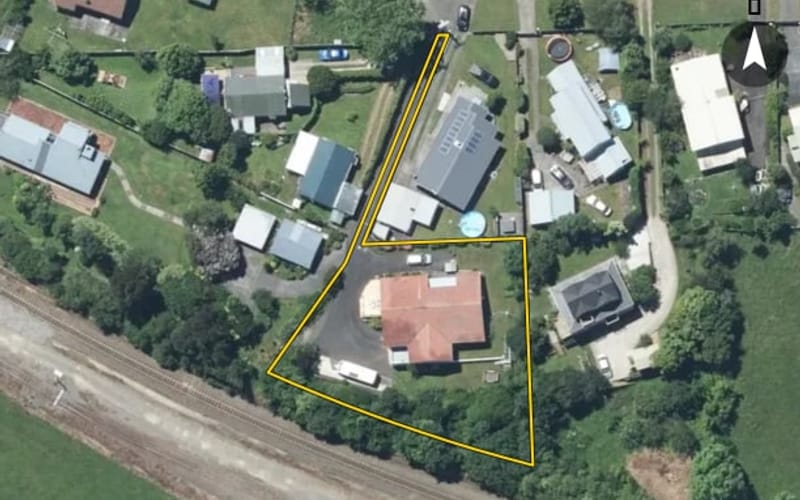
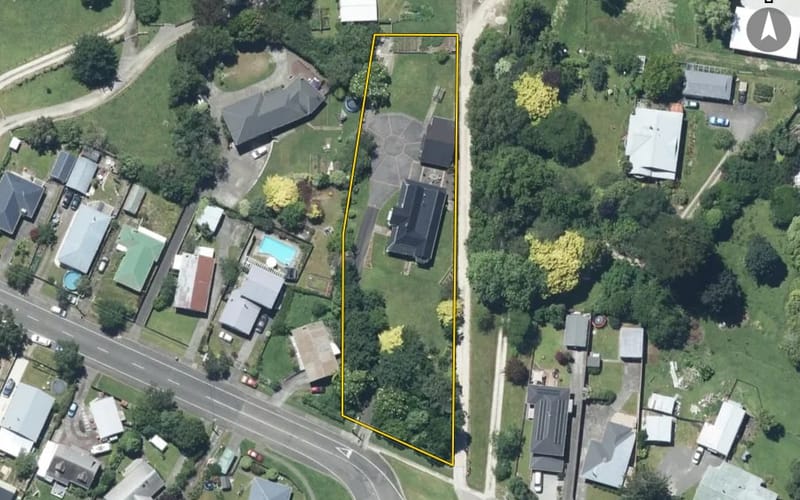
62 properties on No 3 Line, Wanganui East

Highest and lowest on No 3 Line

Highest-valued home161B No 3 Line$1,625,000council valuation · 308 m² floor · 5,735 m² land
Lowest-valued home141D No 3 Line$265,000council valuation · 1,510 m² land
Highest sale in 2026157 No 3 Line$690,000sold 19 Feb 2026 · 5 bed · 264 m² floor · 1,748 m² land

Property values on No 3 Line

The council values No 3 Line's 60 rated properties between $265,000 and $1,625,000. The middle half sit between about $452,000 and $832,500; the median is $595,000 and the mean $661,767.

Lowest: $265k$265kLowest10%: $415k20%: $434k20%30%: $470k40%: $512k40%Median: $595k60%: $694k60%70%: $793k80%: $872k80%90%: $1.0mHighest: $1.63m$1.63mHighest
BedroomsHomesMedian council valueSold, last 12 monthsMedian sale
21$425k0—
329$485k0—
420$825k0—
5+4$845k1—

Council rating valuations: the council's figure for apportioning rates, not a market appraisal.

No 3 Line compared with Wanganui East

No 3 Line's median council value is 37% above Wanganui East's.

No 3 LineWanganui EastWhanganui
Median council value$595k$435k$480k
Sold in the last 12 months3.2%3.4%3.2%
Time between sales5.3 yrs7.3 yrs7.9 yrs
Median section1,658 m²744 m²809 m²
Median year built197019501960
Council value per m² of floor$4k$4k$4k

No 3 Line house prices over time

Median sale price by year; 2026 is the year so far. A year with fewer than two sales has no bar.

2016: too few sales to say (1 sale)20162017: $225k (3 sales)$225k2018: $230k (5 sales)20182019: $584k (2 sales)2020: $513k (10 sales)20202021: $600k (5 sales)2022: too few sales to say (1 sale)20222023: $751k (2 sales)2024: too few sales to say (1 sale)20242025: $1.28m (4 sales)$1.28m2026: too few sales to say (1 sale, this year so far)2026
Sales by year as a table
YearSalesMedian pricePer m² floor
20261$690,000$2,614
20254$1,279,250$4,521
20241$560,000$3,060
20232$751,000$4,067
20221$925,000$4,947
20215$600,000$4,145
202010$512,500$3,423
20192$583,750$3,791
20185$230,000$2,356
20173$225,000$1,875
20161$520,000$2,407

Recent sales on No 3 Line

  • 157 No 3 Line$690,00019 Feb 2026 · 5 bed · 264 m² floor · 1,748 m² land
  • 161B No 3 Line$1,665,0004 Oct 2025 · 308 m² floor · 5,735 m² land
  • 199 No 3 Line$1,080,00027 Mar 2025 · 5 bed · 274 m² floor · 1,151 m² land
  • 141C No 3 Line$1,478,50010 Feb 2025 · 4 bed · 298 m² floor · 7,909 m² land
  • 176A No 3 Line$555,00016 Jan 2025 · 4 bed · 136 m² floor · 736 m² land
  • 192 No 3 Line$560,0005 Feb 2024 · 5 bed · 183 m² floor · 751 m² land
  • 231 No 3 Line$1,010,00017 Nov 2023 · 5 bed · 187 m² floor · 20,487 m² land
  • 187 No 3 Line$492,00012 May 2023 · 3 bed · 180 m² floor · 749 m² land
  • 231 No 3 Line$925,00030 Mar 2022 · 5 bed · 187 m² floor · 20,487 m² land
  • 185A No 3 Line$380,00020 Oct 2021 · 3,434 m² land
  • 192 No 3 Line$630,00018 Aug 2021 · 5 bed · 183 m² floor · 751 m² land
  • 176A No 3 Line$600,00021 Jul 2021 · 4 bed · 136 m² floor · 736 m² land
  • 145 No 3 Line$520,0002 Jul 2021 · 4 bed · 110 m² floor · 556 m² land
  • 157B No 3 Line$640,00013 May 2021 · 4 bed · 165 m² floor · 1,025 m² land
  • 227 No 3 Line$590,0003 Dec 2020 · 3 bed · 147 m² floor · 15,102 m² land
  • 161A No 3 Line$626,0001 Dec 2020 · 3 bed · 86 m² floor · 9,878 m² land
  • 157 No 3 Line$660,00018 Nov 2020 · 5 bed · 264 m² floor · 1,748 m² land
  • 176B No 3 Line$440,00030 Oct 2020 · 3 bed · 100 m² floor · 769 m² land
  • 190 No 3 Line$575,00010 Sept 2020 · 3 bed · 124 m² floor · 726 m² land
  • 192 No 3 Line$450,0008 Jul 2020 · 5 bed · 183 m² floor · 751 m² land

The homes on No 3 Line

No 3 Line has 59 houses, 2 sections and 1 unit or townhouse. More were built in the 1970s than in any other decade (21%).

1900s: 2 (2 homes)21910s: 4 (4 homes)1910s1920s: 5 (5 homes)1930s: 4 (4 homes)1930s1950s: 2 (2 homes)1960s: 11 (11 homes)1960s1970s: 12 (12 homes)121980s: 7 (7 homes)1980s1990s: 1 (1 home)2000s: 5 (5 homes)2000s2010s: 2 (2 homes)2020s: 2 (2 homes)22020s

How long owners stay on No 3 Line

Homes on No 3 Line that resold in the last five years had been held a median 5.3 years (Wanganui East: 7.3 years).

Time between a home's sales, for 9 resales in the last five years. A home not sold since our records begin is not counted, so owners who stay longest are under-represented.

Building and resource consents on No 3 Line

4building consents in the last 5 years
  • 141C No 3 Line1 Mar 2026 · Building consentInsulation of a new narellan in ground fiberglass swimming pool including waste water & pool fencing
  • 192 No 3 Line1 Mar 2023 · Building consentClose in under existing roof to form ensuite & extend off front to form enclosed porch
  • 161B No 3 Line1 Apr 2022 · Building consentConstruct gge & workshop
  • 161B No 3 Line1 Jan 2022 · Building consentConstruct new dwg

No 3 Line in other suburbs

Sales and valuations as at 11 September 2026, from council and LINZ records. Medians resting on fewer than 3 sales are not shown.