
$700,000 CV
12
115-121 Talbot Street, Wanganui East
Talbot Street in Wanganui East has 99 properties, valued by the council between $150,000 and $700,000 with a median of $340,000 (Wanganui East: $435,000). More of its homes were built in the 1960s than in any other decade. We estimate its homes at a median $350,000. 2 sold in the last twelve months. The highest sale in 2026 was 57 Talbot Street, at $375,000.


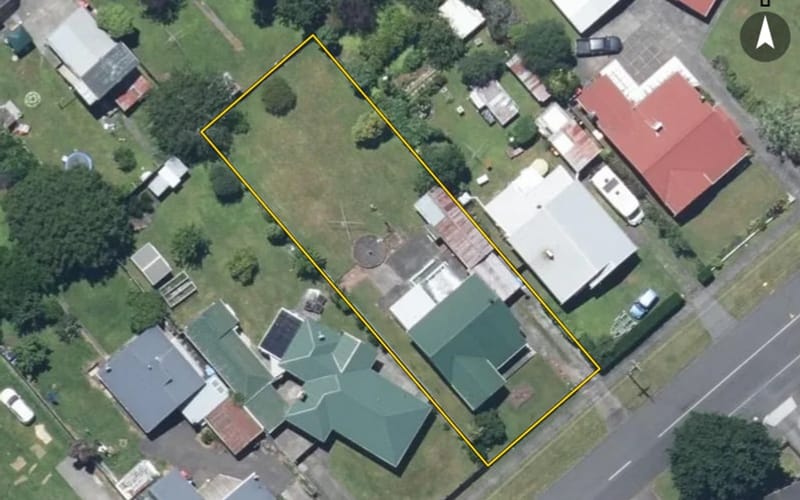
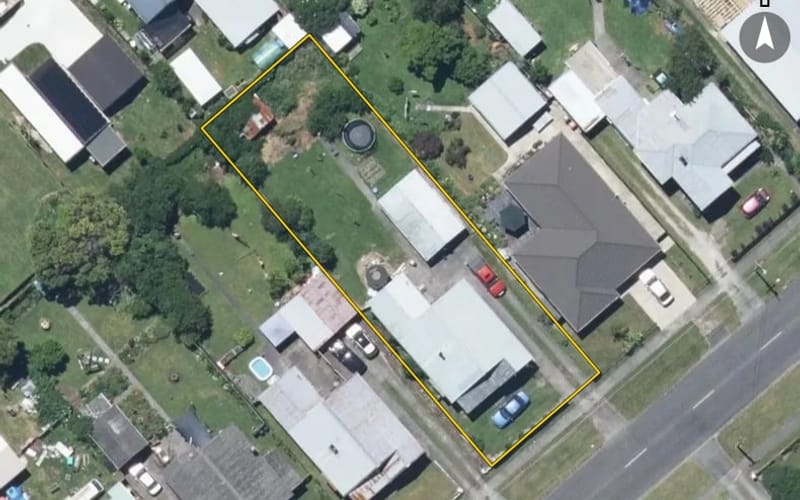


The council values Talbot Street's 93 rated properties between $150,000 and $700,000. The middle half sit between about $275,000 and $374,000; the median is $340,000 and the mean $335,054.
| Bedrooms | Homes | Median council value | Sold, last 12 months | Median sale |
|---|---|---|---|---|
| 2 | 4 | $300k | 0 | — |
| 3 | 78 | $343k | 2 | — |
| 4 | 4 | $403k | 0 | — |
| 5+ | 3 | $245k | 0 | — |
Council rating valuations: the council's figure for apportioning rates, not a market appraisal.
Talbot Street's median council value is 22% below Wanganui East's.
| Talbot Street | Wanganui East | Whanganui | |
|---|---|---|---|
| Median council value | $340k | $435k | $480k |
| Sold in the last 12 months | 2% | 3.4% | 3.2% |
| Time between sales | 6.6 yrs | 7.3 yrs | 7.9 yrs |
| Median section | 672 m² | 744 m² | 809 m² |
| Median year built | 1960 | 1950 | 1960 |
| Council value per m² of floor | $3k | $4k | $4k |
Median sale price by year; 2026 is the year so far. A year with fewer than two sales has no bar.
| Year | Sales | Median price | Per m² floor |
|---|---|---|---|
| 2026 | 1 | $375,000 | $3,750 |
| 2025 | 8 | $315,000 | $2,942 |
| 2024 | 1 | $283,000 | $3,675 |
| 2023 | 4 | $335,000 | $2,462 |
| 2022 | 2 | $405,000 | $5,123 |
| 2021 | 6 | $395,000 | $3,936 |
| 2020 | 8 | $211,250 | $1,993 |
| 2019 | 10 | $204,000 | $1,923 |
| 2018 | 8 | $102,500 | $1,026 |
| 2017 | 4 | $158,750 | $915 |
| 2016 | 5 | $110,000 | $800 |
Talbot Street has 90 houses, 8 units and townhouses and 1 section. More were built in the 1960s than in any other decade (48%).
Homes on Talbot Street that resold in the last five years had been held a median 6.6 years (Wanganui East: 7.3 years).
Time between a home's sales, for 19 resales in the last five years. A home not sold since our records begin is not counted, so owners who stay longest are under-represented.
Every street in Wanganui East, and the suburb's house prices and sales.
Sales and valuations as at 11 September 2026, from council and LINZ records. Medians resting on fewer than 3 sales are not shown.