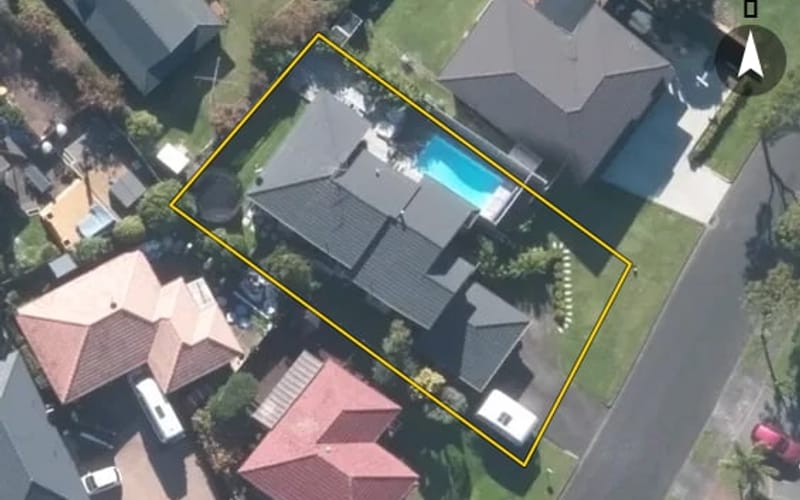
Estimate $1.24m – $1.58m
4
7 Billabong Place, Botany Downs
Billabong Place in Botany Downs has 25 properties, valued by the council between $880,000 and $1,500,000 with a median of $1,225,000 (Botany Downs: $1,225,000). Most of its homes were built in the 1980s. We estimate its homes at a median $1,160,000. The last sale we have was in February 2025, for $1,300,000.


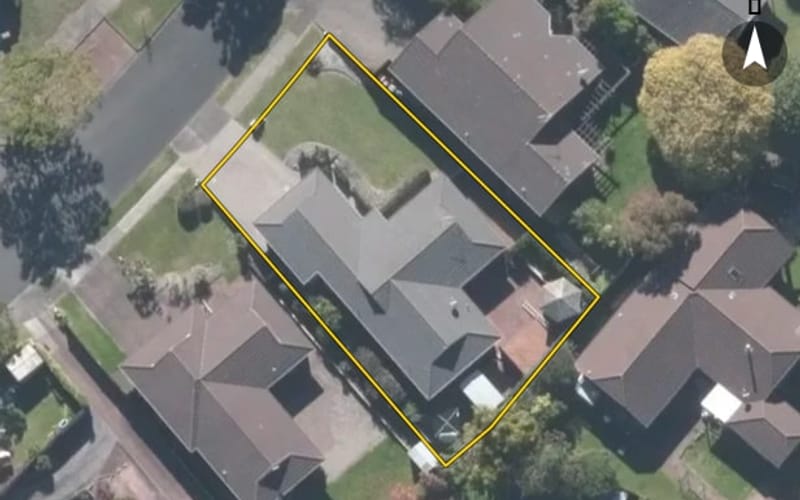


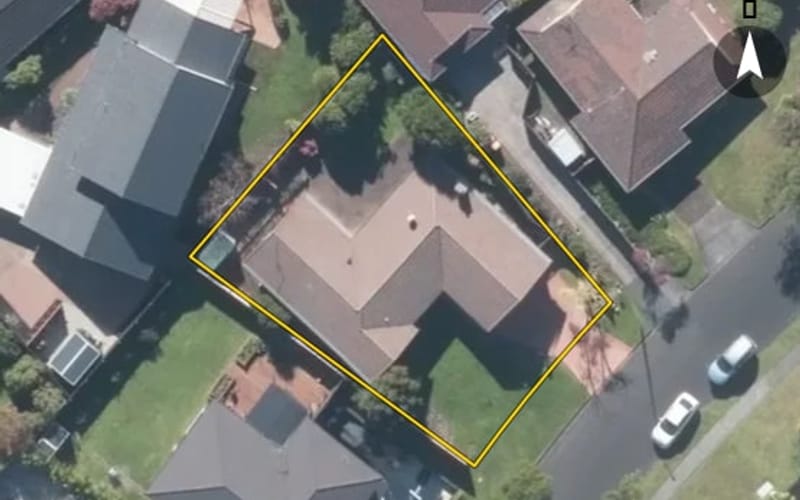

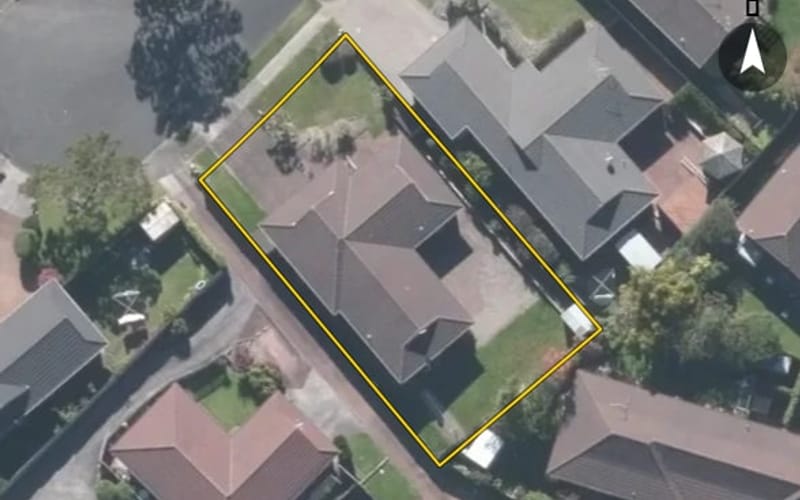

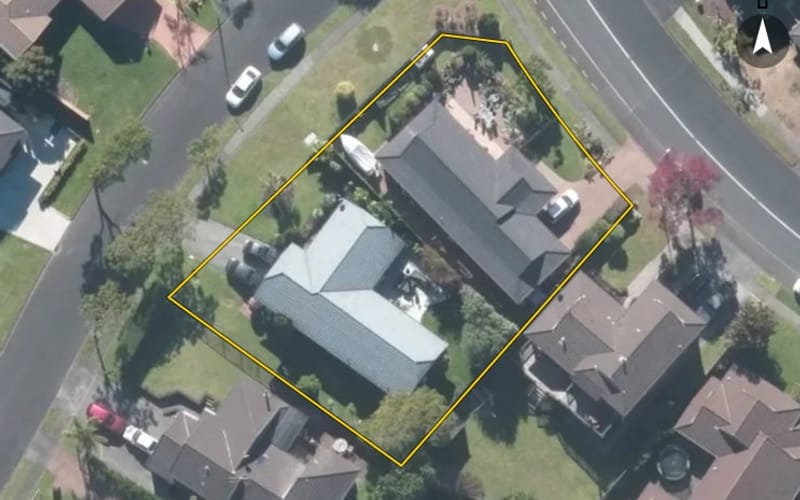
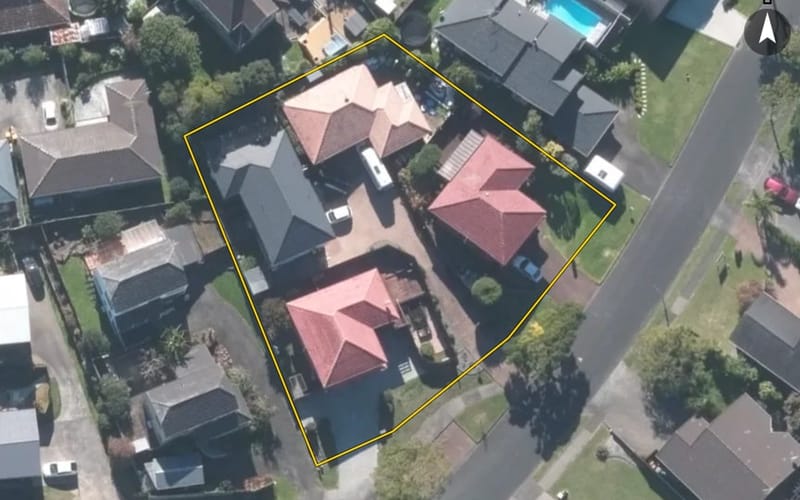


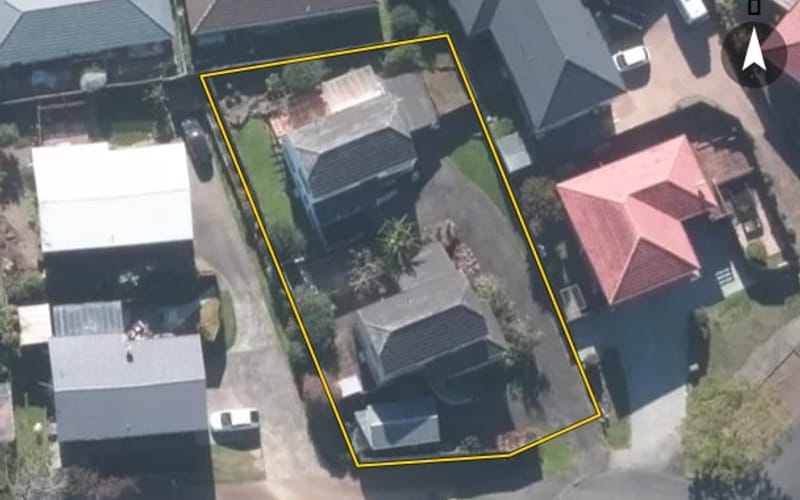


The council values Billabong Place's 25 rated properties between $880,000 and $1,500,000. The middle half sit between about $1,127,500 and $1,412,500; the median is $1,225,000 and the mean $1,264,200.
| Bedrooms | Homes | Median council value | Sold, last 12 months | Median sale |
|---|---|---|---|---|
| 2 | 1 | $1.05m | 0 | — |
| 3 | 11 | $1.13m | 0 | — |
| 4 | 13 | $1.4m | 0 | — |
Council rating valuations: the council's figure for apportioning rates, not a market appraisal.
Billabong Place's median council value is about the same as Botany Downs's.
| Billabong Place | Botany Downs | Auckland | |
|---|---|---|---|
| Median council value | $1.23m | $1.23m | $1.07m |
| Median section | 676 m² | 625 m² | 607 m² |
| Median year built | 1980 | 1980 | 1980 |
| Council value per m² of floor | $8k | $8k | $8k |
Median sale price by year; 2025 is the year so far. A year with fewer than two sales has no bar.
| Year | Sales | Median price | Per m² floor |
|---|---|---|---|
| 2025 | 1 | $1,300,000 | $7,647 |
| 2024 | 1 | $1,455,000 | $6,929 |
| 2022 | 1 | $1,000,000 | $7,692 |
| 2019 | 1 | $910,000 | $7,583 |
| 2018 | 4 | $1,009,000 | $5,983 |
| 2017 | 4 | $915,000 | $6,538 |
| 2016 | 2 | $985,000 | $6,258 |
Billabong Place has 19 houses and 6 units and townhouses. Most were built in the 1980s (68%).
Every street in Botany Downs, and the suburb's house prices and sales.
Sales and valuations as at 11 September 2026, from council and LINZ records. Medians resting on fewer than 3 sales are not shown.