45 properties · Milford, Auckland

Cecil Road, Milford

Cecil Road in Milford has 45 properties, valued by the council between $840,000 and $5,550,000 with a median of $2,987,500 (Milford: $1,425,000). More of its homes were built in the 1970s than in any other decade. We estimate its homes at a median $3,250,000. 1 sold in the last twelve months. The highest sale in 2026 was 2/4 Cecil Road, at $1,110,000.

$2.99mmedian council valuation
$3.25mour median estimate
1sold in the last 12 months
1980median year built
AucklandMilford ×Cecil Road ×

45 properties on Cecil Road, Milford

Highest and lowest on Cecil Road

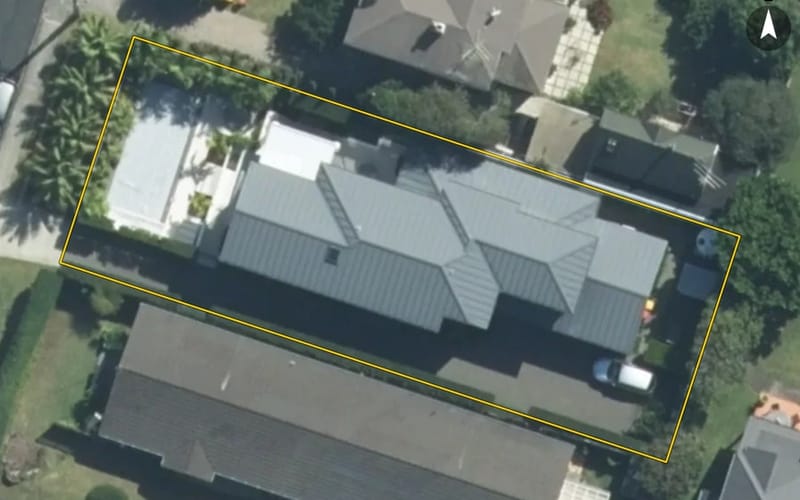
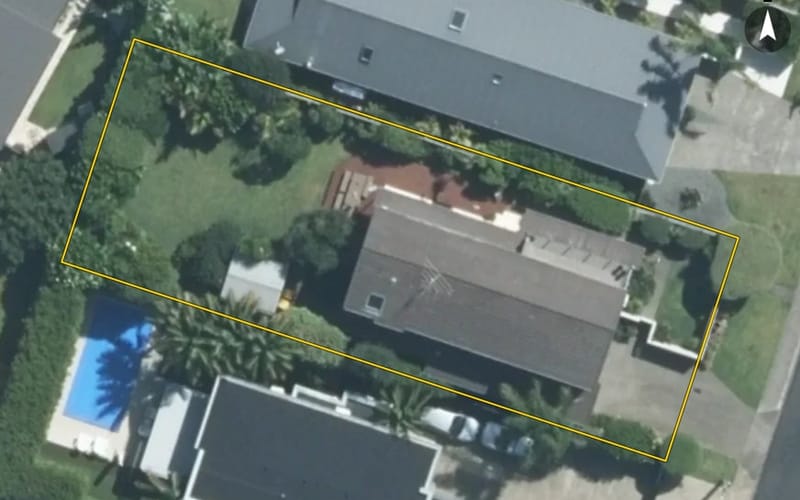
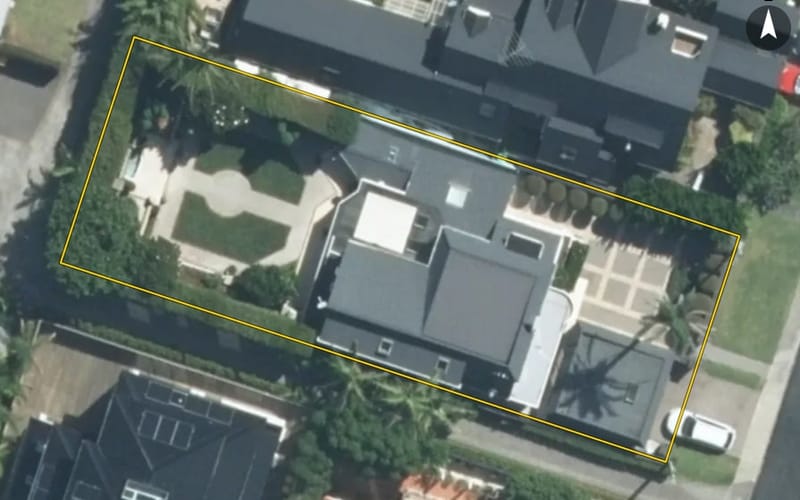
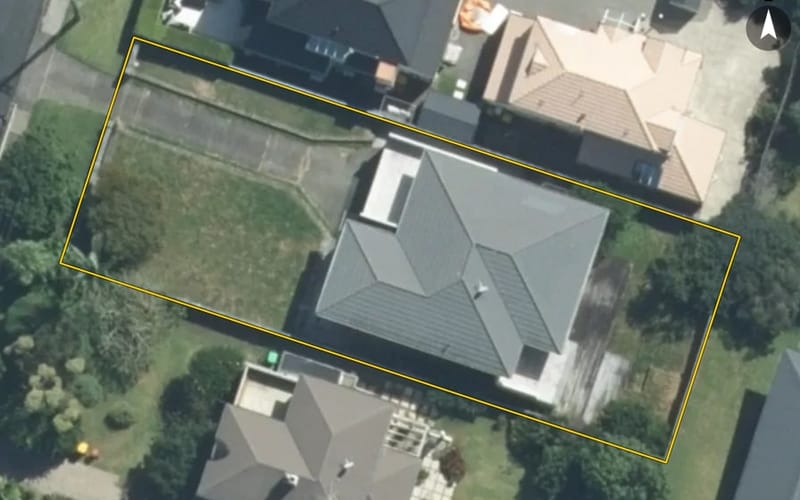
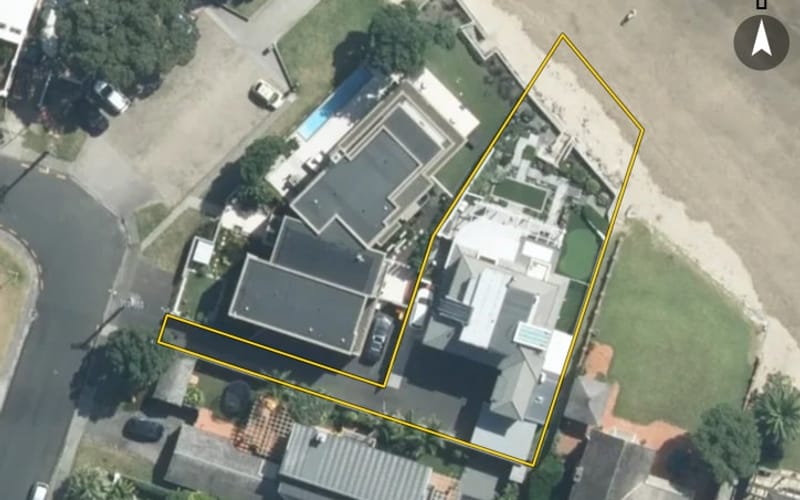
Highest-valued home18 Cecil Road$5,550,000council valuation · 5 bed · 354 m² floor · 632 m² land
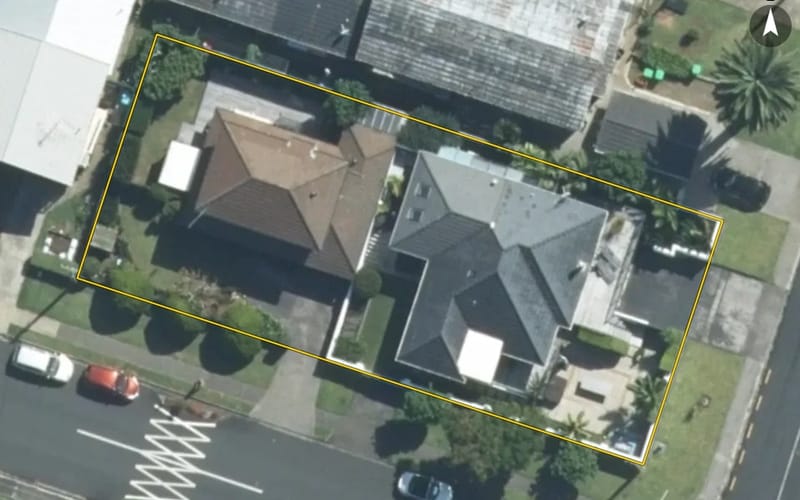
Lowest-valued home3/4 Cecil Road$840,000council valuation
Highest sale in 20262/4 Cecil Road$1,110,000sold 17 Jul 2026 · 2 bed · 100 m² floor

Property values on Cecil Road

The council values Cecil Road's 40 rated properties between $840,000 and $5,550,000. The middle half sit between about $1,952,500 and $4,282,500; the median is $2,987,500 and the mean $3,082,250.

Lowest: $840k$840kLowest10%: $1.2m20%: $1.73m20%30%: $2.17m40%: $2.81m40%Median: $2.99m60%: $3.54m60%70%: $4.13m80%: $4.44m80%90%: $4.64mHighest: $5.55m$5.55mHighest
BedroomsHomesMedian council valueSold, last 12 monthsMedian sale
11$3.38m0—
25$1.77m1—
39$2.77m0—
416$3.75m0—
5+4$4.55m0—

Council rating valuations: the council's figure for apportioning rates, not a market appraisal.

Cecil Road compared with Milford

Cecil Road's median council value is 110% above Milford's.

Cecil RoadMilfordAuckland
Median council value$2.99m$1.43m$1.07m
Sold in the last 12 months2.2%2.7%3.6%
Median section632 m²576 m²607 m²
Median year built198019701980
Council value per m² of floor$16k$11k$8k

Cecil Road house prices over time

Median sale price by year; 2026 is the year so far. A year with fewer than two sales has no bar.

2016: $820k (2 sales)$820k20162017: $2.88m (2 sales)2018: $3.48m (3 sales)$3.48m20182019: $1.57m (2 sales)2020: $2.08m (3 sales)20202021: $2.7m (2 sales)2023: $3.1m (3 sales)20232025: $2.08m (2 sales)$2.08m2026: too few sales to say (1 sale, this year so far)2026
Sales by year as a table
YearSalesMedian pricePer m² floor
20261$1,110,000$11,100
20252$2,078,750$12,777
20233$3,100,000$19,444
20212$2,697,500$11,919
20203$2,075,000$9,881
20192$1,573,500$12,375
20183$3,475,000$13,912
20172$2,875,000$11,488
20162$820,000$10,312

Recent sales on Cecil Road

The homes on Cecil Road

Cecil Road has 24 houses and 21 units and townhouses. More were built in the 1970s than in any other decade (23%).

1920s: 3 (3 homes)31940s: 1 (1 home)1940s1950s: 2 (2 homes)1960s: 3 (3 homes)1960s1970s: 8 (8 homes)81980s: 7 (7 homes)1980s1990s: 4 (4 homes)2000s: 4 (4 homes)2000s2010s: 1 (1 home)2020s: 2 (2 homes)22020s

Building and resource consents on Cecil Road

1resource consents in the last 5 years
  • 11A Cecil Road21 May 2025 · Resource consentThe proposed subdivision seeks to legalise the location of an existing block wall associated with the garage at 11 Cecil Road and extends slightly over the boundary and into 13 Cecil Road.

Cecil Road in other suburbs

Sales and valuations as at 11 September 2026, from council and LINZ records. Medians resting on fewer than 3 sales are not shown.