Currey Crescent, Milford
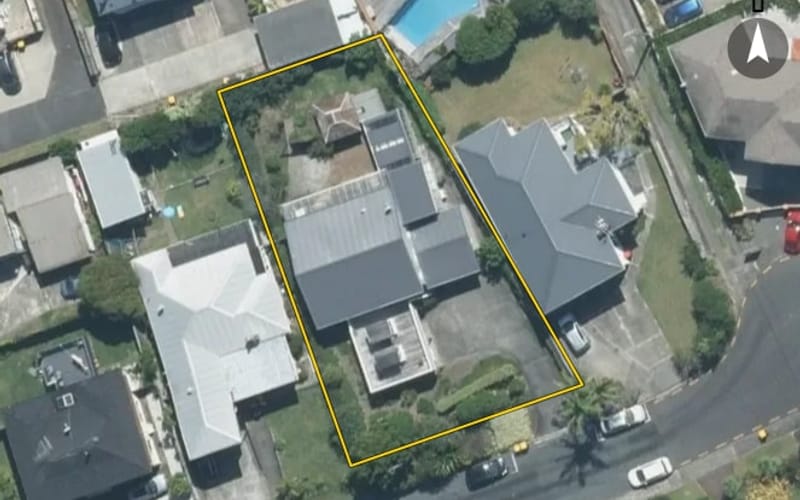
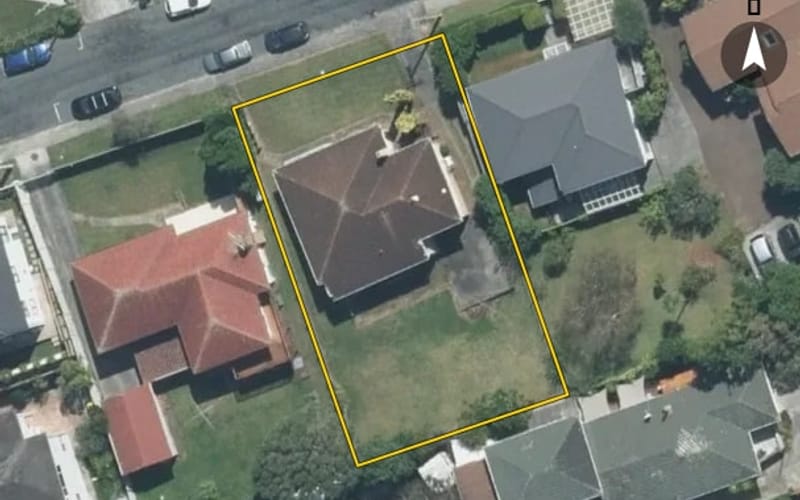
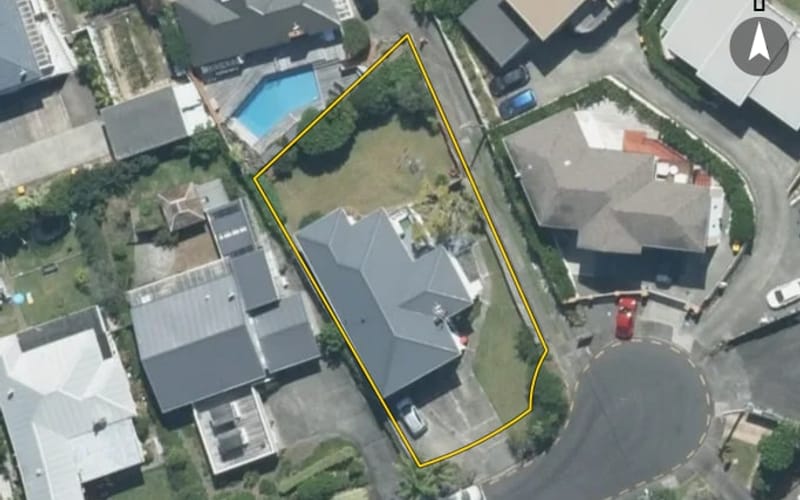
Currey Crescent in Milford has 25 properties, valued by the council between $1,100,000 and $2,625,000 with a median of $1,625,000 (Milford: $1,425,000). More of its homes were built in the 1950s than in any other decade. We estimate its homes at a median $1,580,000. The last sale we have was in July 2024, for $1,570,000.
25 properties on Currey Crescent, Milford


Highest and lowest on Currey Crescent
Property values on Currey Crescent
The council values Currey Crescent's 23 rated properties between $1,100,000 and $2,625,000. The middle half sit between about $1,167,500 and $2,125,000; the median is $1,625,000 and the mean $1,713,043.
| Bedrooms | Homes | Median council value | Sold, last 12 months | Median sale |
|---|---|---|---|---|
| 1 | 1 | $2.6m | 0 | — |
| 3 | 8 | $1.1m | 0 | — |
| 4 | 11 | $1.63m | 0 | — |
| 5+ | 3 | $2.15m | 0 | — |
Council rating valuations: the council's figure for apportioning rates, not a market appraisal.
Currey Crescent compared with Milford
Currey Crescent's median council value is 14% above Milford's.
| Currey Crescent | Milford | Auckland | |
|---|---|---|---|
| Median council value | $1.63m | $1.43m | $1.07m |
| Median section | 452 m² | 576 m² | 607 m² |
| Median year built | 1990 | 1970 | 1980 |
| Council value per m² of floor | $9k | $11k | $8k |
Currey Crescent house prices over time
Median sale price by year; 2024 is the year so far. A year with fewer than two sales has no bar.
Sales by year as a table
| Year | Sales | Median price | Per m² floor |
|---|---|---|---|
| 2024 | 1 | $1,570,000 | $11,214 |
| 2023 | 6 | $1,108,000 | $8,830 |
| 2022 | 1 | $2,460,000 | $8,255 |
| 2021 | 3 | $1,327,000 | $10,550 |
| 2016 | 2 | $1,553,000 | $6,827 |
Recent sales on Currey Crescent
- 10 Currey Crescent$1,570,00021 Jul 2024 · 4 bed · 140 m² floor · 694 m² land
- 1F Currey Crescent$995,00018 Jun 2023 · 4 bed · 121 m² floor · 120 m² land
- 1D Currey Crescent$1,110,00012 Jun 2023 · 3 bed · 124 m² floor · 96 m² land
- 1A Currey Crescent$1,106,0005 Jun 2023 · 3 bed · 127 m² floor · 95 m² land
- 1E Currey Crescent$1,120,1005 Jun 2023 · 3 bed · 124 m² floor · 96 m² land
- 1C Currey Crescent$1,120,00014 May 2023 · 3 bed · 124 m² floor · 96 m² land
- 1B Currey Crescent$1,050,00030 Apr 2023 · 3 bed · 124 m² floor · 92 m² land
- 8 Currey Crescent$2,460,00028 Jan 2022 · 5 bed · 298 m² floor · 453 m² land
- 10 Currey Crescent$1,710,00027 Jul 2021 · 4 bed · 140 m² floor · 694 m² land
- 10A Currey Crescent$1,150,00023 Apr 2021 · 7 bed · 109 m² floor · 448 m² land
- 14 Currey Crescent$1,327,0002 Feb 2021 · 4 bed · 180 m² floor · 375 m² land
- 7 Currey Crescent$2,005,00015 Aug 2016 · 4 bed · 266 m² floor · 484 m² land
- 14 Currey Crescent$1,101,00029 Apr 2016 · 4 bed · 180 m² floor · 375 m² land
- 12 Currey Crescent$1,439,8887 Dec 2015 · 4 bed · 230 m² floor · 637 m² land
- 14 Currey Crescent$1,010,00013 Sept 2015 · 4 bed · 180 m² floor · 375 m² land
- 1 Currey Crescent$1,565,80030 Jul 2015 · 4 bed · 164 m² floor · 685 m² land
- 5 Currey Crescent$1,302,0007 Dec 2014 · 1 bed · 380 m² floor · 860 m² land
- 2 Currey Crescent$935,00022 May 2014 · 3 bed · 140 m² floor · 690 m² land
- 7 Currey Crescent$1,293,8006 May 2013 · 4 bed · 266 m² floor · 484 m² land
- 7A Currey Crescent$1,080,00028 Jun 2012 · 4 bed · 272 m² floor · 474 m² land
The homes on Currey Crescent
Currey Crescent has 22 houses and 3 units and townhouses. More were built in the 1950s than in any other decade (30%).
More streets in Milford
- Nile Road328
- Shakespeare Road273
- Kitchener Road224
- East Coast Road151
- Corunna Road125
- Saltburn Road106
- Omana Road103
- Milford Road97
- Stanley Avenue97
- Belmont Terrace96
- Wolsley Avenue96
- Quebec Road92
Every street in Milford, and the suburb's house prices and sales.
Sales and valuations as at 11 September 2026, from council and LINZ records. Medians resting on fewer than 3 sales are not shown.