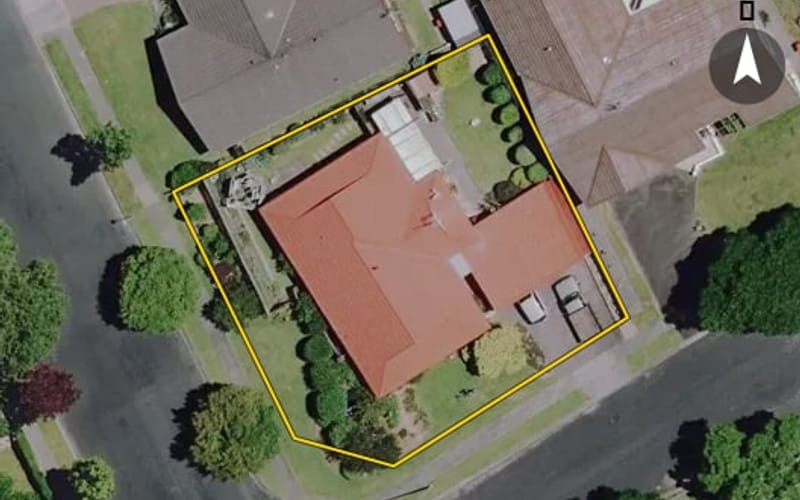
Estimate $1.03m – $1.38m
3
1 Ellerslie Avenue, Chartwell
Ellerslie Avenue in Chartwell has 51 properties, valued by the council between $520,000 and $1,230,000 with a median of $950,000 (Chartwell: $780,000). Most of its homes were built in the 1980s. We estimate its homes at a median $951,000. 4 sold in the last twelve months, for a median $1,027,500. The highest sale in 2026 was 34 Ellerslie Avenue, at $1,045,000.




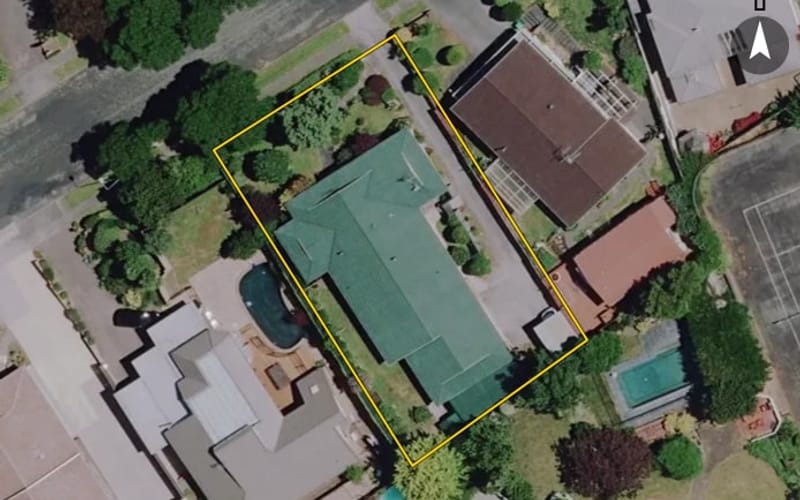
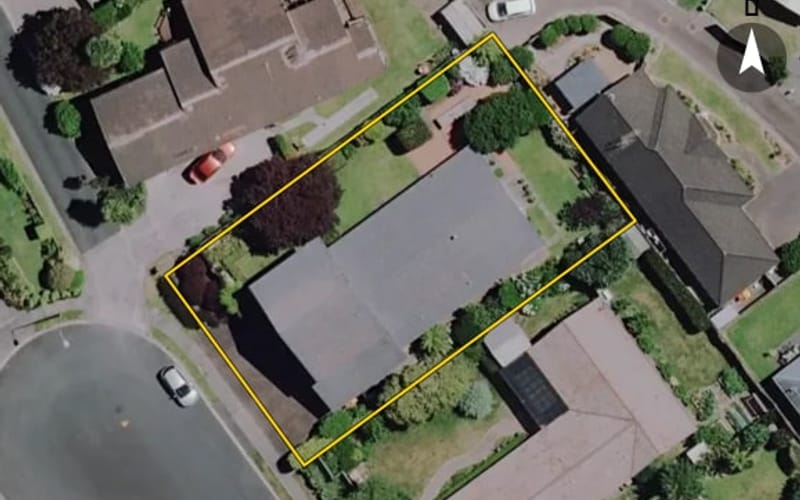


The council values Ellerslie Avenue's 51 rated properties between $520,000 and $1,230,000. The middle half sit between about $880,000 and $1,012,500; the median is $950,000 and the mean $937,059.
| Bedrooms | Homes | Median council value | Sold, last 12 months | Median sale |
|---|---|---|---|---|
| 3 | 9 | $980k | 1 | — |
| 4 | 34 | $930k | 2 | — |
| 5+ | 6 | $1.02m | 1 | — |
Council rating valuations: the council's figure for apportioning rates, not a market appraisal.
Ellerslie Avenue's median council value is 22% above Chartwell's.
| Ellerslie Avenue | Chartwell | Hamilton | |
|---|---|---|---|
| Median council value | $950k | $780k | $760k |
| Median sale, last 12 months | $1.03m | $860k | $780k |
| Sold in the last 12 months | 7.8% | 4.6% | 3.8% |
| Time between sales | 21.8 yrs | 6.2 yrs | 7.8 yrs |
| Median section | 728 m² | 622 m² | 698 m² |
| Median year built | 1980 | 1970 | 1990 |
| Council value per m² of floor | $4k | $5k | $5k |
Median sale price by year; 2026 is the year so far. A year with fewer than two sales has no bar.
| Year | Sales | Median price | Per m² floor |
|---|---|---|---|
| 2026 | 2 | $1,027,500 | $4,436 |
| 2025 | 3 | $952,000 | $4,600 |
| 2024 | 3 | $930,000 | $3,932 |
| 2023 | 2 | $966,500 | $4,190 |
| 2022 | 2 | $1,000,000 | $4,783 |
| 2021 | 5 | $1,137,000 | $4,817 |
| 2020 | 5 | $775,000 | $3,745 |
| 2018 | 4 | $713,000 | $3,373 |
| 2016 | 5 | $700,000 | $2,925 |
Ellerslie Avenue has 47 houses, 2 units and townhouses and 2 sections. Most were built in the 1980s (96%).
Homes on Ellerslie Avenue that resold in the last five years had been held a median 21.8 years (Chartwell: 6.2 years).
Time between a home's sales, for 15 resales in the last five years. A home not sold since our records begin is not counted, so owners who stay longest are under-represented.
Every street in Chartwell, and the suburb's house prices and sales.
Sales and valuations as at 11 September 2026, from council and LINZ records. Medians resting on fewer than 3 sales are not shown.