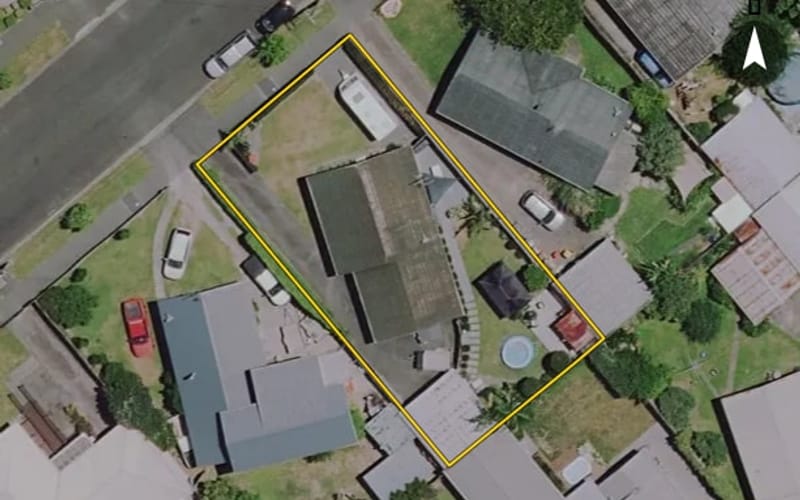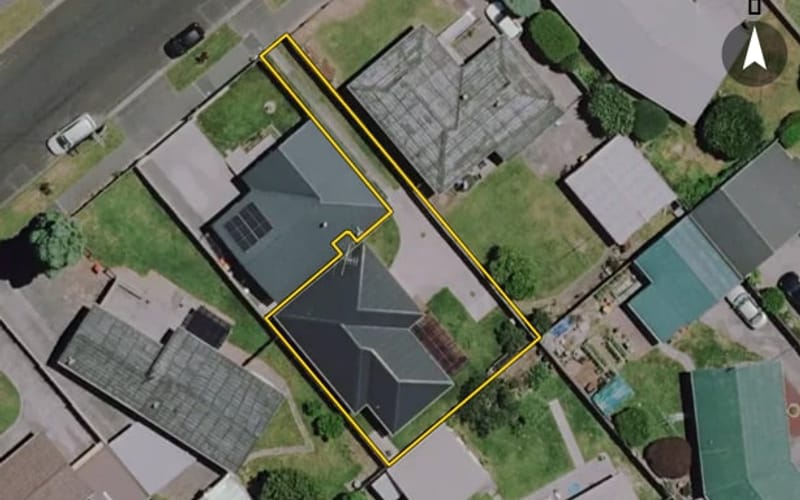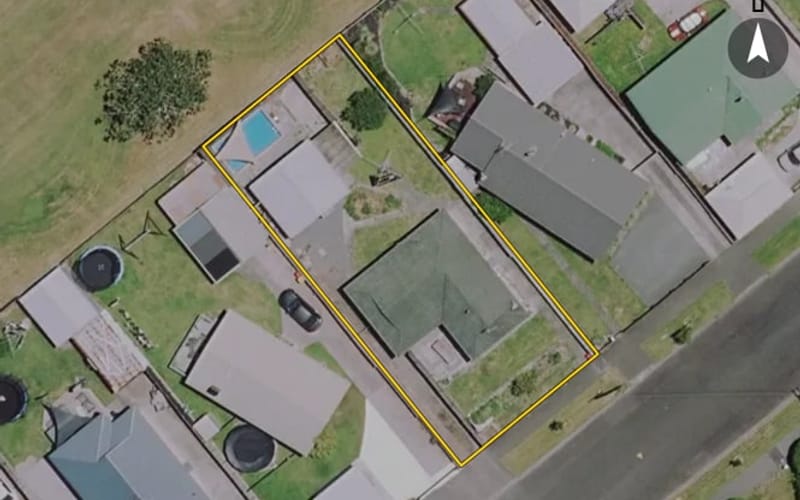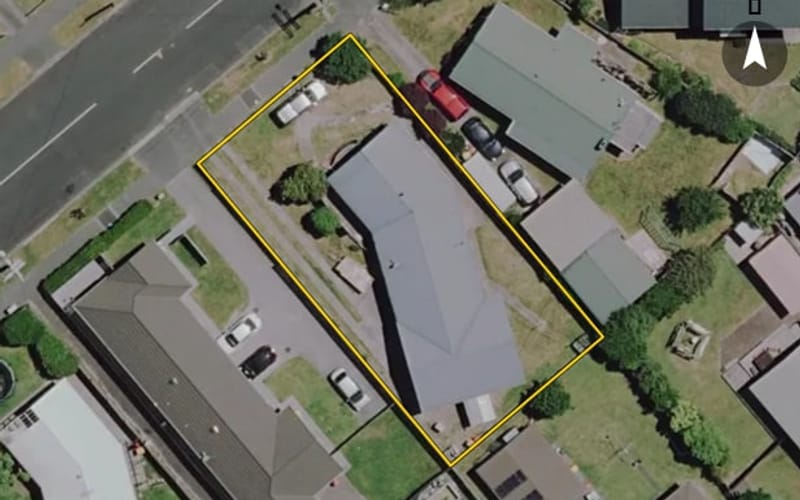
54 properties · St Andrews, Hamilton

Cecil Street, St Andrews

Cecil Street in St Andrews has 54 properties, valued by the council between $560,000 and $1,000,000 with a median of $710,000 (St Andrews: $730,000). More of its homes were built in the 1960s than in any other decade. We estimate its homes at a median $738,000. 2 sold in the last twelve months. The highest sale in 2026 was 36 Cecil Street, at $1,040,000.

$710kmedian council valuation
$738kour median estimate
2sold in the last 12 months
1970median year built
HamiltonSt Andrews ×Cecil Street ×

54 properties on Cecil Street, St Andrews

Highest and lowest on Cecil Street

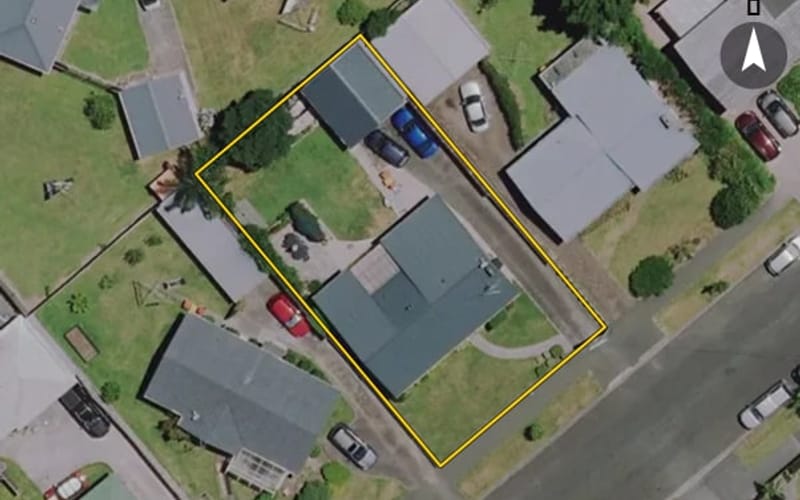
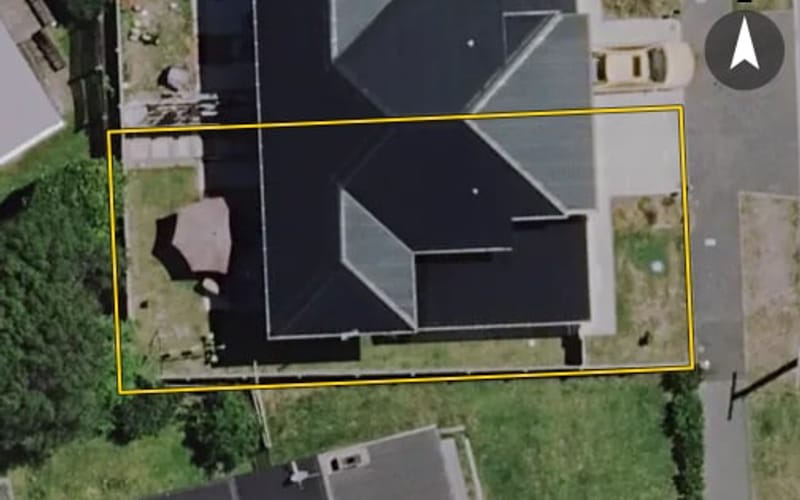
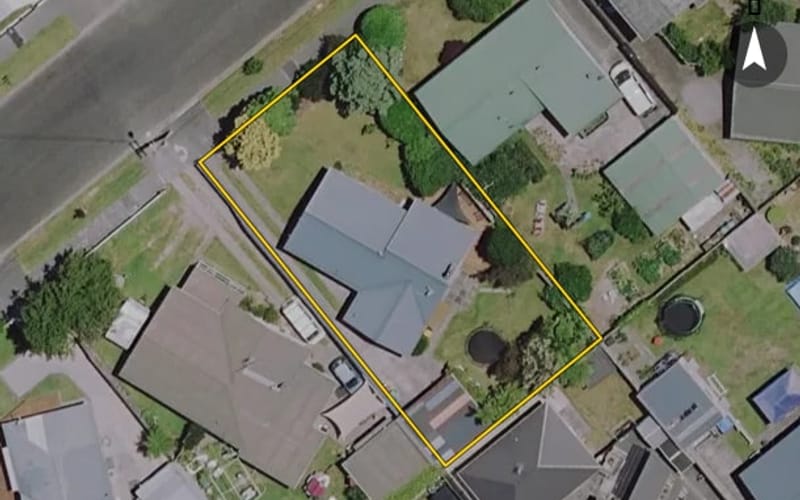
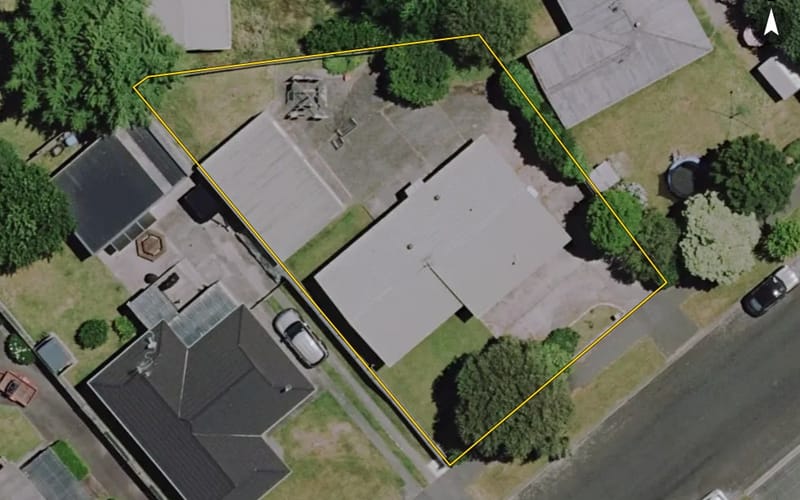
Highest-valued home21A Cecil Street$1,000,000council valuation · 2 bed · 214 m² floor · 632 m² land
Lowest-valued home29B Cecil Street$560,000council valuation · 3 bed · 110 m² floor · 272 m² land
Highest sale in 202636 Cecil Street$1,040,000sold 21 May 2026 · 6 bed · 203 m² floor · 703 m² land

Property values on Cecil Street

The council values Cecil Street's 50 rated properties between $560,000 and $1,000,000. The middle half sit between about $690,000 and $736,000; the median is $710,000 and the mean $718,600.

Lowest: $560k$560kLowest10%: $670k20%: $690k20%30%: $690k40%: $700k40%Median: $710k60%: $720k60%70%: $730k80%: $742k80%90%: $750kHighest: $1.0m$1.0mHighest
BedroomsHomesMedian council valueSold, last 12 monthsMedian sale
21$1.0m0—
337$700k1—
48$740k0—
5+1$970k1—

Council rating valuations: the council's figure for apportioning rates, not a market appraisal.

Cecil Street compared with St Andrews

Cecil Street's median council value is 3% below St Andrews's.

Cecil StreetSt AndrewsHamilton
Median council value$710k$730k$760k
Sold in the last 12 months3.7%4%3.8%
Time between sales7.8 yrs8.6 yrs7.8 yrs
Median section646 m²685 m²698 m²
Median year built197019701990
Council value per m² of floor$6k$6k$5k

Cecil Street house prices over time

Median sale price by year; 2026 is the year so far. A year with fewer than two sales has no bar.

2016: $658k (2 sales)$658k20162017: $512k (3 sales)2018: $503k (4 sales)20182019: $698k (2 sales)2020: $645k (2 sales)20202021: $807k (11 sales)2022: too few sales to say (1 sale)20222023: $735k (3 sales)2026: $895k (2 sales, this year so far)$895k2026
Sales by year as a table
YearSalesMedian pricePer m² floor
20262$895,000$6,509
20233$735,000$6,125
20221$685,000$6,524
202111$806,500$6,824
20202$645,000$5,375
20192$697,500$4,571
20184$502,750$4,788
20173$512,000$4,773
20162$658,000$4,180

Recent sales on Cecil Street

  • 36 Cecil Street$1,040,00021 May 2026 · 6 bed · 203 m² floor · 703 m² land
  • 4 Cecil Street$750,00029 Apr 2026 · 3 bed · 95 m² floor · 784 m² land
  • 19 Cecil Street$735,00029 Nov 2023 · 3 bed · 120 m² floor · 647 m² land
  • 38 Cecil Street$722,50031 Oct 2023 · 3 bed · 120 m² floor · 703 m² land
  • 12 Cecil Street$748,50014 Aug 2023 · 3 bed · 110 m² floor · 647 m² land
  • 59 Cecil Street$685,00018 Dec 2022 · 3 bed · 105 m² floor · 688 m² land
  • 34 Cecil Street$842,00020 Dec 2021 · 3 bed · 121 m² floor · 645 m² land
  • 42 Cecil Street$580,00018 Nov 2021 · 3 bed · 85 m² floor · 703 m² land
  • 26 Cecil Street$900,00017 Nov 2021 · 3 bed · 100 m² floor · 736 m² land
  • 48 Cecil Street$789,00029 Sept 2021 · 3 bed · 100 m² floor · 736 m² land
  • 45 Cecil Street$907,00028 Sept 2021 · 4 bed · 151 m² floor · 642 m² land
  • 53 Cecil Street$795,00021 Jul 2021 · 3 bed · 90 m² floor · 634 m² land
  • 9 Cecil Street$930,0001 Jul 2021 · 3 bed · 260 m² floor · 642 m² land
  • 12 Cecil Street$835,00016 Jun 2021 · 3 bed · 110 m² floor · 647 m² land
  • 13 Cecil Street$794,0008 Jun 2021 · 3 bed · 170 m² floor · 746 m² land
  • 29B Cecil Street$610,00012 Apr 2021 · 3 bed · 110 m² floor · 272 m² land
  • 45 Cecil Street$806,50028 Jan 2021 · 4 bed · 151 m² floor · 642 m² land
  • 29A Cecil Street$650,00020 Nov 2020 · 3 bed · 120 m² floor · 368 m² land
  • 19 Cecil Street$640,0004 Aug 2020 · 3 bed · 120 m² floor · 647 m² land
  • 31 Cecil Street$545,00011 Nov 2019 · 3 bed · 110 m² floor · 647 m² land

The homes on Cecil Street

Cecil Street has 51 houses and 3 apartments. More were built in the 1960s than in any other decade (44%).

1910s: 1 (1 home)11910s1960s: 22 (22 homes)221960s1970s: 22 (22 homes)1970s2010s: 1 (1 home)2010s2020s: 4 (4 homes)42020s

How long owners stay on Cecil Street

Homes on Cecil Street that resold in the last five years had been held a median 7.8 years (St Andrews: 8.6 years).

Time between a home's sales, for 10 resales in the last five years. A home not sold since our records begin is not counted, so owners who stay longest are under-represented.

Building and resource consents on Cecil Street

1building consents in the last 5 years

Sales and valuations as at 11 September 2026, from council and LINZ records. Medians resting on fewer than 3 sales are not shown.