Property for rent in Yelverton, Blenheim
Houses, townhouses, apartments and sections, farms and lifestyle blocks, and commercial and industrial sites for rent in Yelverton, Blenheim, each listing beside what the property would rent for, its title, school zones and running costs.
0 properties for rent in Yelverton
Nothing in Yelverton is advertised for rent on the sites we follow just now; .
About Yelverton
Homes sold for a median $4,656 per square metre of floor over the last twelve months. Homes in Yelverton change hands every 11.6 years on median, against 8.1 across Blenheim and 7.9 nationally. About 2.7% of its homes sold in the last twelve months.
Schools zoned for Yelverton
- Springlands Schoolprimary · Years 1-6
- Bohally Intermediateintermediate · Years 7-8
Yelverton house prices over time
Median sale price by year, all homes; 2026 is the year so far. Yelverton's median sale price over the last twelve months was $745k, across 5 sales, down 3% on the twelve months before. Across Blenheim it was $660k.
Sales by year as a table
| Year | Sales | Median price | Per m² floor | Per m² land (est.) | Blenheim median |
|---|---|---|---|---|---|
| 2026 | 4 | — | — | — | $643,000 |
| 2025 | 8 | $720,000 | $4,538 | $410 | $660,000 |
| 2024 | 8 | $977,500 | $5,011 | $371 | $653,250 |
| 2023 | 6 | $1,285,000 | $4,891 | $210 | $660,000 |
| 2022 | 5 | $939,000 | $5,767 | $518 | $695,000 |
| 2021 | 10 | $590,500 | $1,953 | $185 | $640,000 |
| 2020 | 7 | $619,000 | $3,148 | $118 | $490,000 |
| 2019 | 3 | — | — | — | $430,500 |
| 2018 | 10 | $487,500 | $2,779 | $322 | $400,000 |
| 2017 | 6 | $927,500 | $2,911 | $93 | $380,000 |
| 2016 | 6 | $552,500 | $3,063 | $280 | $330,000 |
Estimated value, month by month
Our model's median estimate for homes in Yelverton, level over the last twelve months. An automated estimate, not a registered valuation.
Prices by bedrooms in Yelverton
| Bedrooms | Homes | Median council value | Sold, last 12 months | Median sale | Per m² floor |
|---|---|---|---|---|---|
| 2 | 5 | $710k | 1 | — | $6,250 |
| 3 | 58 | $685k | 2 | — | $5,185 |
| 4 | 55 | $1.26m | 2 | — | $4,806 |
| 5+ | 22 | $1.56m | 0 | — | $4,658 |
Price per square metre
Homes in Yelverton sold for a median $4,656 per square metre of floor over the last twelve months, land included (Blenheim: $4,471); the land under houses sold for an estimated $438 per square metre (Blenheim: $500). A sale price is not split between land and house, so the land figure gives the land the council's share of each sale — the land value as a part of the capital value at the last revaluation.
Recent sales in Yelverton
- 22-24 Battys Road$710,00030 Jul 2026 · 2 bed · 172 m² floor · 670 m² land
- 96 Battys Road$600,0008 Jun 2026 · 3 bed · 120 m² floor · 809 m² land
- 24 Severne Street$1,350,00010 May 2026 · 4 bed · 230 m² floor · 1,844 m² land
- 79 Lakings Road$745,00027 Feb 2026 · 3 bed · 160 m² floor · 1,353 m² land
- 68 Lakings Road$790,00025 Nov 2025 · 4 bed · 270 m² floor · 530 m² land
- 95 Battys Road$560,00016 Sept 2025 · 1 bed · 111 m² floor · 1,295 m² land
- 28 Battys Road$1,225,00010 Sept 2025 · 3 bed · 152 m² floor · 4,704 m² land
- 77D Lakings Road$522,5002 Sept 2025 · 3 bed · 115 m² floor · 558 m² land
- 67 Lakings Road$680,00029 Jun 2025 · 3 bed · 150 m² floor · 766 m² land
- 2 David Street$500,00028 May 2025 · 3 bed · 140 m² floor · 988 m² land
- 87 Lakings Road$760,00021 May 2025 · 4 bed · 240 m² floor · 1,073 m² land
- 79 Lakings Road$780,00011 Mar 2025 · 3 bed · 160 m² floor · 1,353 m² land
How long owners stay in Yelverton
Homes in Yelverton change hands every 11.6 years on median, against 8.1 across Blenheim and 7.9 nationally.
By kind: houses 11.6 years.
Time between a home's sales, for homes that resold in the last five years. A home not sold since our records begin is not counted, so owners who stay longest are under-represented.
Who lives in Yelverton
About 216 people lived in Yelverton at the 2023 census (down 12% since 2018); their median age was about 47 (Blenheim: 44); 86% of households owned their home (Blenheim: 72%).
Age
- 30-64 years44%
- 65 years and over26%
- 15-29 years17%
- Under 15 years15%
Households
- One-family household (with or without other people)75%
- One-person household21%
- Other multi-person household4%
- Two-family household (with or without other people)0%
- Three or more family household (with or without other people)0%
Ethnicity
- European85%
- Māori10%
- Pacific Peoples7%
- Asian3%
- Other Ethnicity3%
- Middle Eastern/Latin American/African0%
Where people were born
- New Zealand83%
- Europe (excl United Kingdom and Ireland)4%
- Asia3%
- Australia3%
- Pacific Islands3%
- United Kingdom and Ireland3%
- North America1%
- Other0%
Household income
- $100,001-$150,00021%
- $30,001-$50,00018%
- $200,001 or more18%
- $20,001-$30,00011%
- $70,001-$100,00011%
- $150,001-$200,00011%
- $50,001-$70,0007%
- $20,000 or less4%
Dwellings
- Separate house93%
- Joined dwelling3%
- Non-private dwelling3%
- Other private dwelling0%
Highest qualification
- No qualification24%
- Level 2 certificate15%
- Level 1 certificate11%
- Level 4 certificate11%
- Bachelor degree and Level 7 qualification11%
- Level 3 certificate8%
- Level 6 diploma5%
- Post-graduate and honours degrees5%
Stats NZ Census 2023 and 2018, summed over the census areas inside Yelverton. Medians are approximate: Stats NZ publishes them per area and they cannot be added up exactly.
Real estate agents selling in Yelverton
12 agents have been credited on a sale or a live listing in Yelverton in the last two years. Those with the most:
- Samantha LewisHarcourts Marlborough2 sales here
- Andre BezarWinder & Co1 sale here
- Lorraine BarrettTall Poppy Real Estate1 sale here
- Michael ReaRay White Blenheim & Picton1 sale here
- Sophie SmithHarcourts Marlborough1 sale here
- Rosa TateHarcourts Marlborough1 sale here
- Kurt LindsayBayleys Top of the South1 sale here
- Samantha MacDonaldBayleys Top of the South1 sale here
- Ben McLennanHarcourts Marlborough1 sale here
- David SearleHarcourts Marlborough1 sale here
- Glenn KirbyBayleys Top of the South1 sale here
- Georgia O'MalleyBayleys Top of the South1 sale here
All 12 real estate agents in Yelverton, with their recent sales and which agencies sell the suburb.
Counted from sales records that name the agent, and from current listings. A count of activity, not a rating.
Building and resource consents in Yelverton
- 79 Lakings Road1 Jun 2026 · Building consentRelocation of existing gge on site
- 61 David Street1 Jun 2026 · Building consentFree-standing masport osburn 1600 solid fuel heater
- 119 David Street1 May 2026 · Building consentDwg alterations & free-standing pellet fire
- 30 Battys Road1 Mar 2026 · Building consentRes alterations & additions
- 30 Battys Road1 Mar 2026 · Building consentConnection of original dwg (lot 8) & one relocated dwg (lot 4) to new services
Search building consents in Yelverton and see Stats NZ's count of new homes there.
Sales and valuations as at 18 September 2026, from council and LINZ records. Figures resting on fewer than 5 sales are not shown.
About property for rent in Yelverton, Blenheim
Every property in Yelverton, Blenheim, whether it is for sale or not: homes, sections, farms, lifestyle blocks, shops, offices and industrial land. Each is listed from the council rating roll and Toitū Te Whenua LINZ, with the listing beside it when an agent is marketing it.
Rentals come from the agents and property managers who list them, matched to the property each is for, so every one opens on that property’s own page: its rent estimate, title, hazards, the internet it can get, and its power and insurance costs.
Each property has its own page: our estimate of its value beside the council rating valuation, past sale prices, the title and land area, zoning and hazards, building consents, and what it would cost to own.
Listings are published by the agents who market them. Addresses, land details and rating valuations come from Toitū Te Whenua Land Information New Zealand and from the council. No ownership information is published.
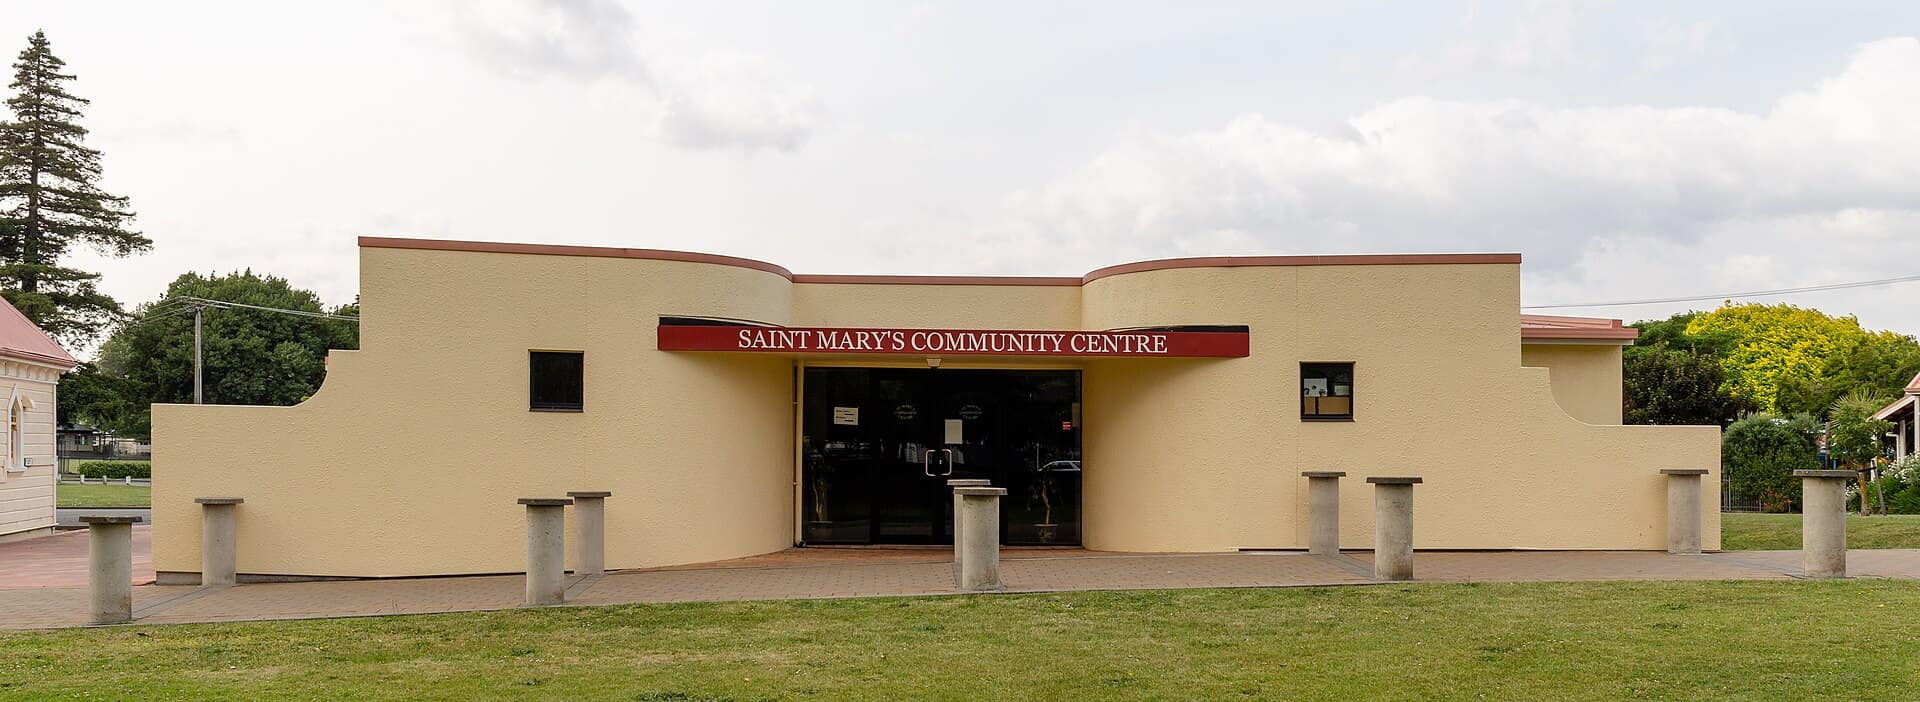
Header photo: Michal Klajban, CC BY-SA 4.0, via Wikimedia Commons (licence).