Property for rent in Flaxmere, Hastings
Houses, townhouses, apartments and sections, farms and lifestyle blocks, and commercial and industrial sites for rent in Flaxmere, Hastings, each listing beside what the property would rent for, its title, school zones and running costs.
0 properties for rent in Flaxmere
Nothing in Flaxmere is advertised for rent on the sites we follow just now; .
About Flaxmere
Two-bedroom homes sold for a median $327k and three-bedroom homes for $495k. Homes sold for a median $4,800 per square metre of floor over the last twelve months. Homes in Flaxmere change hands every 9.0 years on median, against 8.1 across Hastings and 7.9 nationally. About 2.9% of its homes sold in the last twelve months.
Schools zoned for Flaxmere
- Hastings Christian Schoolcomposite · Years 1-13
- Taikura Rudolf Steiner Schoolcomposite · Years 1-13
- Irongate Schoolprimary · Years 1-8
- Flaxmere Primary Schoolprimary · Years 1-8
- Twyford Schoolprimary · Years 1-8
- Te Whai Hiringaprimary · Years 1-8
- Te Kura o Kimi Oraprimary · Years 1-8
- Iona Collegesecondary · Years 7-15
- Lindisfarne Collegesecondary · Years 7-15
- St Joseph's Maori Girls' Collegesecondary · Years 7-15
- Woodford Housesecondary · Years 7-15
- Flaxmere Collegesecondary · Years 7-15
- St John's College (Hastings)secondary · Years 9-15
Flaxmere house prices over time
Median sale price by year, all homes; 2026 is the year so far. Flaxmere's median sale price over the last twelve months was $495k, across 95 sales, down 1% on the twelve months before. Across Hastings it was $630k.
Sales by year as a table
| Year | Sales | Median price | Per m² floor | Per m² land (est.) | Hastings median |
|---|---|---|---|---|---|
| 2026 | 62 | $492,500 | $4,813 | $280 | $620,000 |
| 2025 | 137 | $500,000 | $4,623 | $289 | $618,626 |
| 2024 | 134 | $500,000 | $4,669 | $270 | $625,000 |
| 2023 | 95 | $500,000 | $4,683 | $280 | $640,000 |
| 2022 | 85 | $535,000 | $5,049 | $295 | $640,000 |
| 2021 | 143 | $520,000 | $4,955 | $293 | $660,000 |
| 2020 | 138 | $385,000 | $3,731 | $225 | $490,000 |
| 2019 | 147 | $315,000 | $2,950 | $181 | $430,000 |
| 2018 | 217 | $240,000 | $2,329 | $150 | $370,000 |
| 2017 | 160 | $195,500 | $2,035 | $123 | $330,000 |
| 2016 | 193 | $184,500 | $1,744 | $105 | $276,250 |
Estimated value, month by month
Our model's median estimate for homes in Flaxmere, down 1% over the last twelve months. An automated estimate, not a registered valuation.
Prices by bedrooms in Flaxmere
Over the last twelve months, 2-bedroom homes sold for a median $327k, 3-bedroom homes sold for a median $495k, 4-bedroom homes sold for a median $585k.
| Bedrooms | Homes | Median council value | Sold, last 12 months | Median sale | Per m² floor |
|---|---|---|---|---|---|
| 1 | 5 | $510k | 0 | — | $5,728 |
| 2 | 222 | $365k | 13 | $327k | $4,671 |
| 3 | 2,375 | $460k | 65 | $495k | $4,861 |
| 4 | 139 | $560k | 12 | $585k | $4,321 |
| 5+ | 29 | $615k | 2 | — | $3,439 |
Price per square metre
Homes in Flaxmere sold for a median $4,800 per square metre of floor over the last twelve months, land included (Hastings: $5,183); the land under houses sold for an estimated $289 per square metre (Hastings: $536). A sale price is not split between land and house, so the land figure gives the land the council's share of each sale — the land value as a part of the capital value at the last revaluation.
Recent sales in Flaxmere
- 24 Palgrave Avenue$542,00024 Aug 2026 · 4 bed · 87 m² floor · 780 m² land
- 156 Portsmouth Road$610,0004 Aug 2026 · 3 bed · 130 m² floor · 617 m² land
- 334B Flaxmere Avenue$370,00024 Jul 2026 · 3 bed · 70 m² floor
- 12 Liverpool Crescent$495,00016 Jul 2026 · 3 bed · 100 m² floor · 680 m² land
- 237 Flaxmere Avenue$480,00016 Jul 2026 · 3 bed · 90 m² floor · 700 m² land
- 24 Scott Drive$495,00014 Jul 2026 · 3 bed · 90 m² floor · 877 m² land
- 247A Flaxmere Avenue$490,00013 Jul 2026 · 3 bed · 120 m² floor
- 329 Flaxmere Avenue$350,00011 Jul 2026 · 3 bed · 80 m² floor
- 324 Flaxmere Avenue$355,00010 Jul 2026 · 3 bed · 80 m² floor
- 18 Wilson Road$525,0008 Jul 2026 · 3 bed · 110 m² floor · 627 m² land
- 29 Cartier Crescent$437,5002 Jul 2026 · 3 bed · 90 m² floor · 1,019 m² land
- 70 Tarbet Street$410,00028 Jun 2026 · 3 bed · 83 m² floor · 770 m² land
How long owners stay in Flaxmere
Homes in Flaxmere change hands every 9.0 years on median, against 8.1 across Hastings and 7.9 nationally.
By kind: houses 9.3 years, units & townhouses 6.1 years.
Time between a home's sales, for homes that resold in the last five years. A home not sold since our records begin is not counted, so owners who stay longest are under-represented.
Who lives in Flaxmere
About 11,316 people lived in Flaxmere at the 2023 census (up 4% since 2018); their median age was about 29 (Hastings: 36); 52% of households owned their home (Hastings: 62%).
Age
- 30-64 years38%
- Under 15 years29%
- 15-29 years24%
- 65 years and over10%
Households
- One-family household (with or without other people)67%
- One-person household16%
- Two-family household (with or without other people)9%
- Other multi-person household6%
- Three or more family household (with or without other people)2%
Ethnicity
- Māori59%
- European37%
- Pacific Peoples26%
- Asian4%
- Other Ethnicity1%
- Middle Eastern/Latin American/African0%
Where people were born
- New Zealand85%
- Pacific Islands9%
- Asia2%
- Australia2%
- United Kingdom and Ireland1%
- Middle East and Africa0%
- North America0%
- Europe (excl United Kingdom and Ireland)0%
Household income
- $100,001-$150,00024%
- $70,001-$100,00018%
- $30,001-$50,00012%
- $150,001-$200,00012%
- $50,001-$70,00011%
- $200,001 or more9%
- $20,001-$30,0008%
- $20,000 or less6%
Dwellings
- Separate house89%
- Joined dwelling11%
- Non-private dwelling0%
- Other private dwelling0%
Highest qualification
- No qualification26%
- Level 3 certificate19%
- Level 2 certificate13%
- Level 1 certificate12%
- Level 4 certificate10%
- Level 5 diploma6%
- Bachelor degree and Level 7 qualification6%
- Overseas secondary school qualification3%
Stats NZ Census 2023 and 2018, summed over the census areas inside Flaxmere. Medians are approximate: Stats NZ publishes them per area and they cannot be added up exactly.
Real estate agents selling in Flaxmere
45 agents have been credited on a sale or a live listing in Flaxmere in the last two years. Those with the most:
- David ScapensProperty Brokers Hastings24 sales here
- Jason WhitakerProperty Brokers Hastings22 sales here
- Darren CuneenArizto13 sales here
- James StanfordProperty Brokers Havelock North12 sales here
- Drew ChattertonTremain Real Estate Hastings11 sales here
- Winitana FaaleleTremain Real Estate Hastings9 sales here
- Noel CameronRay White Hawke's Bay Hastings Branch6 sales here
- Shelley ClarkeHarcourts Hastings4 sales here
- Killarney GallagherTall Poppy Real Estate4 sales here
- Carl WezelRay White Hawke's Bay Hastings Branch3 sales here
- Alicia KennedyTremain Real Estate Hastings3 sales here
- Rahia JessupTremain Real Estate Hastings3 sales here
All 45 real estate agents in Flaxmere, with their recent sales and which agencies sell the suburb.
Counted from sales records that name the agent, and from current listings. A count of activity, not a rating.
Building and resource consents in Flaxmere
- 6 Cortes Crescent1 Jul 2026 · Building consentNew kent insert sfh
- 29 Deal Crescent1 Jun 2026 · Building consentNew installation of a metro smart insert solid fuel heater within existing cavity
- 241 Flaxmere Avenue1 Jun 2026 · Building consentConstruction of a 1000 series gge - 6m x 9m
- 21 Tarbet Street1 Jun 2026 · Building consentNew dwg
- 66 Columbus Crescent1 May 2026 · Building consentHome relocation & drainage
- 16 Walton Way11 Nov 2025 · Resource consentS176 outline plan of works for school redevelopment on designated site medu -38
Search building consents in Flaxmere and see Stats NZ's count of new homes there.
Sales and valuations as at 18 September 2026, from council and LINZ records. Figures resting on fewer than 5 sales are not shown.
About property for rent in Flaxmere, Hastings
Every property in Flaxmere, Hastings, whether it is for sale or not: homes, sections, farms, lifestyle blocks, shops, offices and industrial land. Each is listed from the council rating roll and Toitū Te Whenua LINZ, with the listing beside it when an agent is marketing it.
Rentals come from the agents and property managers who list them, matched to the property each is for, so every one opens on that property’s own page: its rent estimate, title, hazards, the internet it can get, and its power and insurance costs.
Each property has its own page: our estimate of its value beside the council rating valuation, past sale prices, the title and land area, zoning and hazards, building consents, and what it would cost to own.
Listings are published by the agents who market them. Addresses, land details and rating valuations come from Toitū Te Whenua Land Information New Zealand and from the council. No ownership information is published.
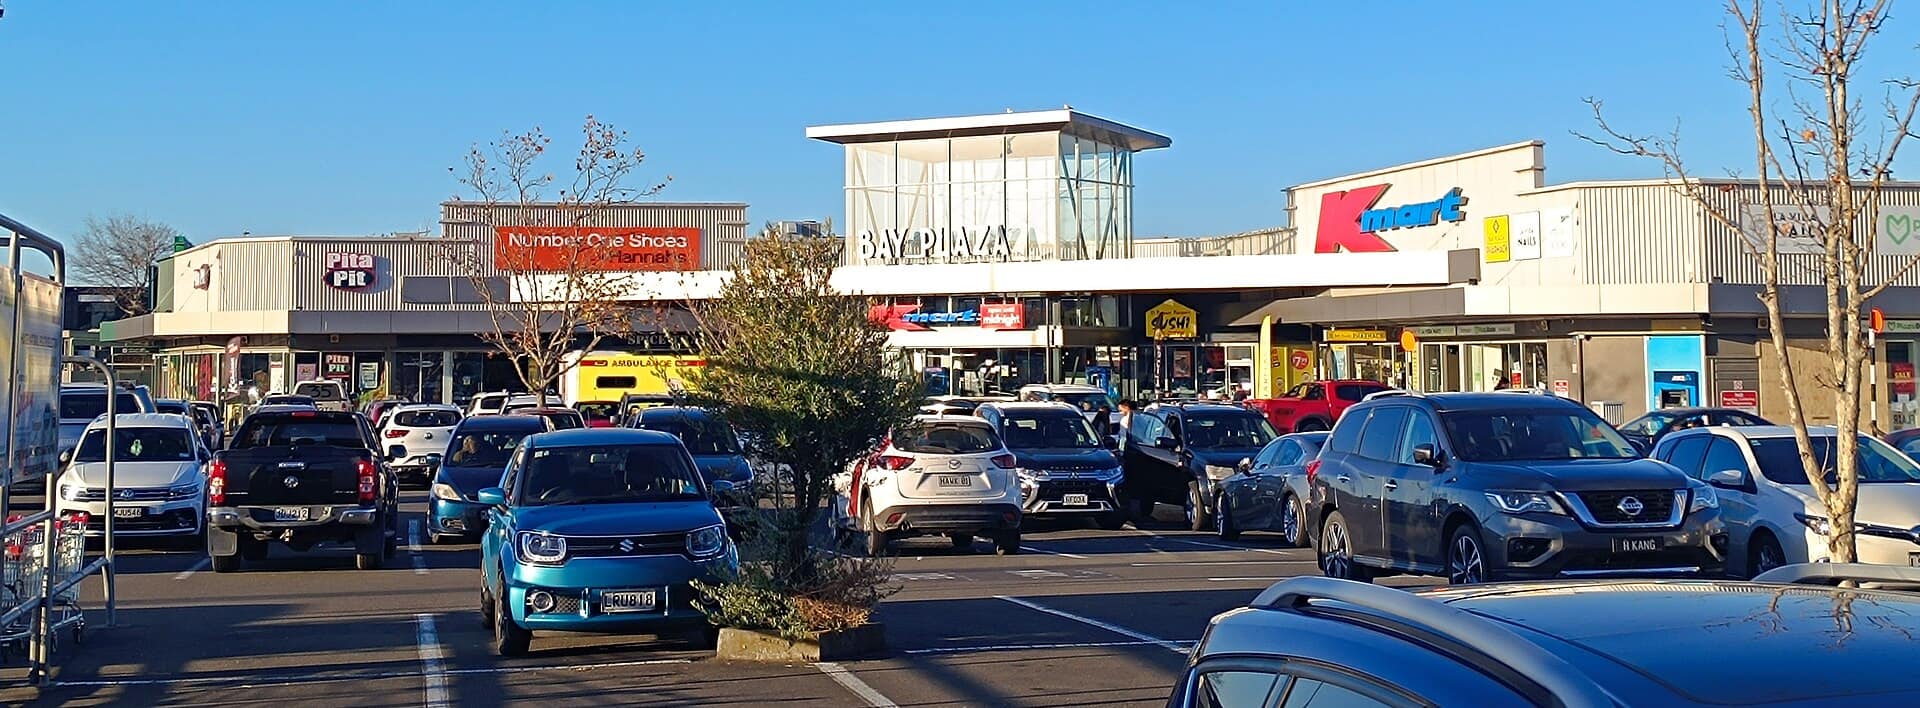
Header photo: Jakob (TheLoyalOrder), CC BY 4.0, via Wikimedia Commons (licence).