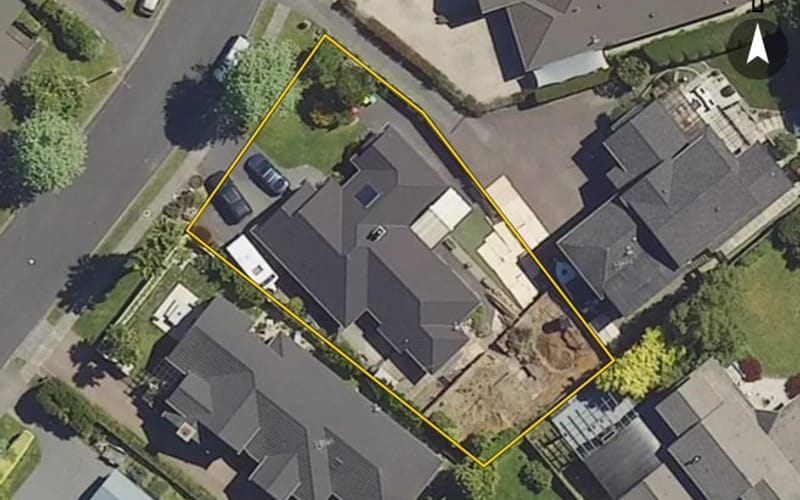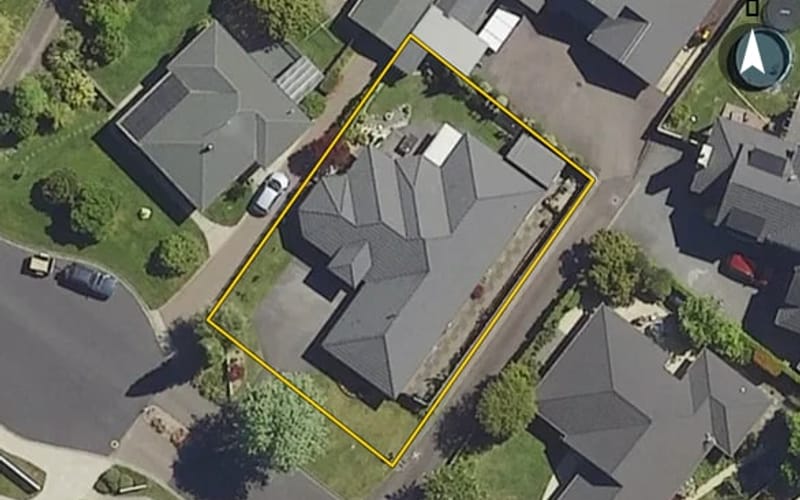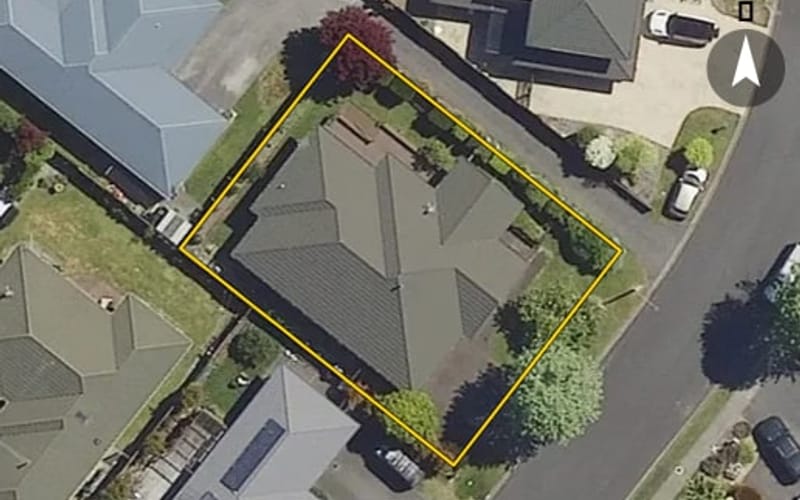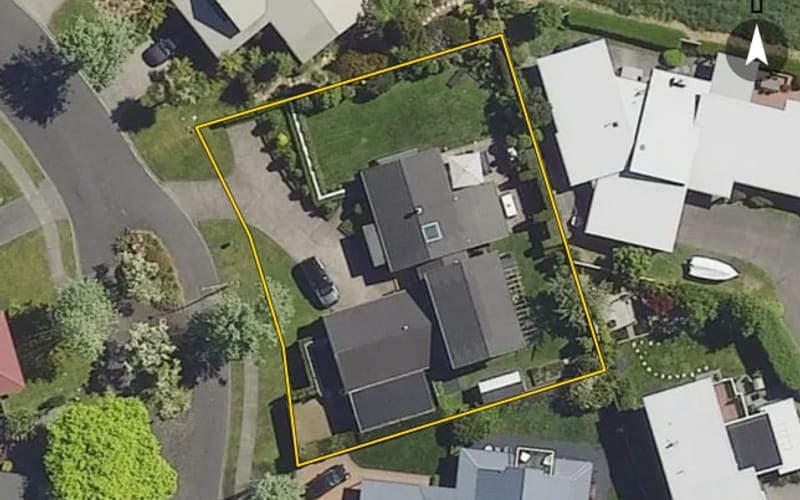
19 properties · Ōwhata, Rotorua

Hayward Rise, Ōwhata

Hayward Rise in Ōwhata has 19 properties, valued by the council between $735,000 and $1,180,000 with a median of $990,000 (Ōwhata: $585,000). Most of its homes were built in the 2000s. We estimate its homes at a median $1,020,000. The last sale we have was in October 2024, for $1,040,000.
$990kmedian council valuation
$1.02mour median estimate
2000median year built
RotoruaŌwhata ×Hayward Rise ×

19 properties on Hayward Rise, Ōwhata

Highest and lowest on Hayward Rise

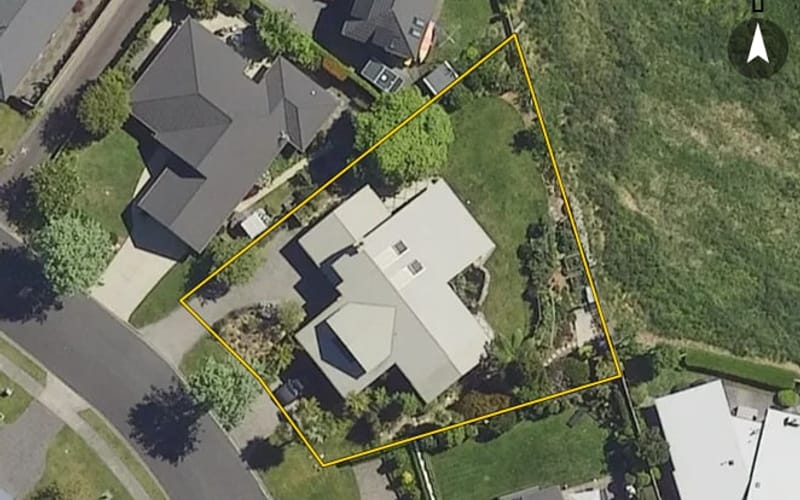
Highest-valued home13-15 Hayward Rise$1,180,000council valuation · 4 bed · 257 m² floor · 962 m² land
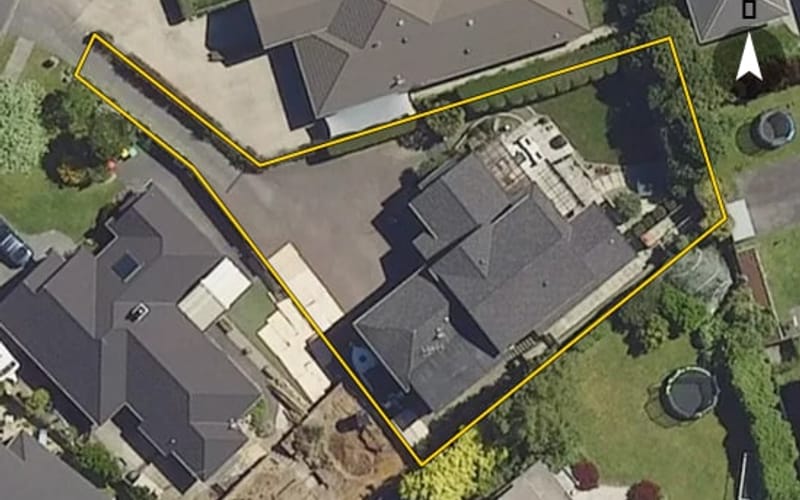
Lowest-valued home1 Hayward Rise$735,000council valuation · 3 bed · 140 m² floor · 612 m² land

Property values on Hayward Rise

The council values Hayward Rise's 19 rated properties between $735,000 and $1,180,000. The middle half sit between about $875,500 and $1,050,000; the median is $990,000 and the mean $970,526.

Lowest: $735k$735kLowest10%: $834k20%: $861k20%30%: $890k40%: $935k40%Median: $990k60%: $994k60%70%: $1.02m80%: $1.08m80%90%: $1.14mHighest: $1.18m$1.18mHighest
BedroomsHomesMedian council valueSold, last 12 monthsMedian sale
34$833k0—
412$990k0—
5+3$1.12m0—

Council rating valuations: the council's figure for apportioning rates, not a market appraisal.

Hayward Rise compared with Ōwhata

Hayward Rise's median council value is 69% above Ōwhata's.

Hayward RiseŌwhataRotorua
Median council value$990k$585k$580k
Median section700 m²722 m²842 m²
Median year built200019801970
Council value per m² of floor$4k$5k$5k

Hayward Rise house prices over time

Median sale price by year; 2024 is the year so far. A year with fewer than two sales has no bar.

2016: $653k (3 sales)$653k20162017: $770k (2 sales)20172018: too few sales to say (1 sale)20182019: too few sales to say (1 sale)20192020: too few sales to say (1 sale)20202022: $990k (3 sales)20222024: $1.04m (3 sales, this year so far)$1.04m2024
Sales by year as a table
YearSalesMedian pricePer m² floor
20243$1,040,000$4,407
20223$990,000$4,480
20201$808,000$3,181
20191$847,000$3,335
20181$715,000$2,544
20172$770,000$2,983
20163$653,000$2,646

Recent sales on Hayward Rise

  • 9 Hayward Rise$1,040,00031 Oct 2024 · 4 bed · 236 m² floor · 801 m² land
  • 5 Hayward Rise$1,045,00026 Mar 2024 · 4 bed · 216 m² floor · 804 m² land
  • 23 Hayward Rise$1,005,00014 Feb 2024 · 5 bed · 281 m² floor · 805 m² land
  • 27 Hayward Rise$990,00021 Oct 2022 · 4 bed · 221 m² floor · 603 m² land
  • 2 Hayward Rise$883,00021 Jul 2022 · 3 bed · 203 m² floor · 565 m² land
  • 21 Hayward Rise$990,00017 Jul 2022 · 4 bed · 194 m² floor · 600 m² land
  • 3 Hayward Rise$808,0007 Jan 2020 · 4 bed · 254 m² floor · 710 m² land
  • 3 Hayward Rise$847,0002 Feb 2019 · 4 bed · 254 m² floor · 710 m² land
  • 23 Hayward Rise$715,00017 Sept 2018 · 5 bed · 281 m² floor · 805 m² land
  • 7 Hayward Rise$885,0007 Dec 2017 · 5 bed · 323 m² floor · 803 m² land
  • 2 Hayward Rise$655,00018 Oct 2017 · 3 bed · 203 m² floor · 565 m² land
  • 9 Hayward Rise$653,00026 May 2016 · 4 bed · 236 m² floor · 801 m² land
  • 13-15 Hayward Rise$680,0009 Mar 2016 · 4 bed · 257 m² floor · 962 m² land
  • 8 Hayward Rise$565,0001 Jan 2016 · 5 bed · 324 m² floor · 655 m² land
  • 12 Hayward Rise$495,00027 Nov 2014 · 4 bed · 229 m² floor · 670 m² land
  • 11 Hayward Rise$490,00026 Jun 2014 · 4 bed · 171 m² floor · 700 m² land
  • 4 Hayward Rise$385,0005 Sept 2013 · 4 bed · 195 m² floor · 541 m² land
  • 3 Hayward Rise$545,0002 Jun 2012 · 4 bed · 254 m² floor · 710 m² land
  • 5 Hayward Rise$490,00016 Sept 2011 · 4 bed · 216 m² floor · 804 m² land
  • 21 Hayward Rise$435,00011 Jul 2011 · 4 bed · 194 m² floor · 600 m² land

The homes on Hayward Rise

Hayward Rise has 19 houses. Most were built in the 2000s (84%).

1960s: 1 (1 home)11960s2000s: 16 (16 homes)162000s2010s: 2 (2 homes)22010s

Building and resource consents on Hayward Rise

1building consents in the last 5 years

Sales and valuations as at 11 September 2026, from council and LINZ records. Medians resting on fewer than 3 sales are not shown.