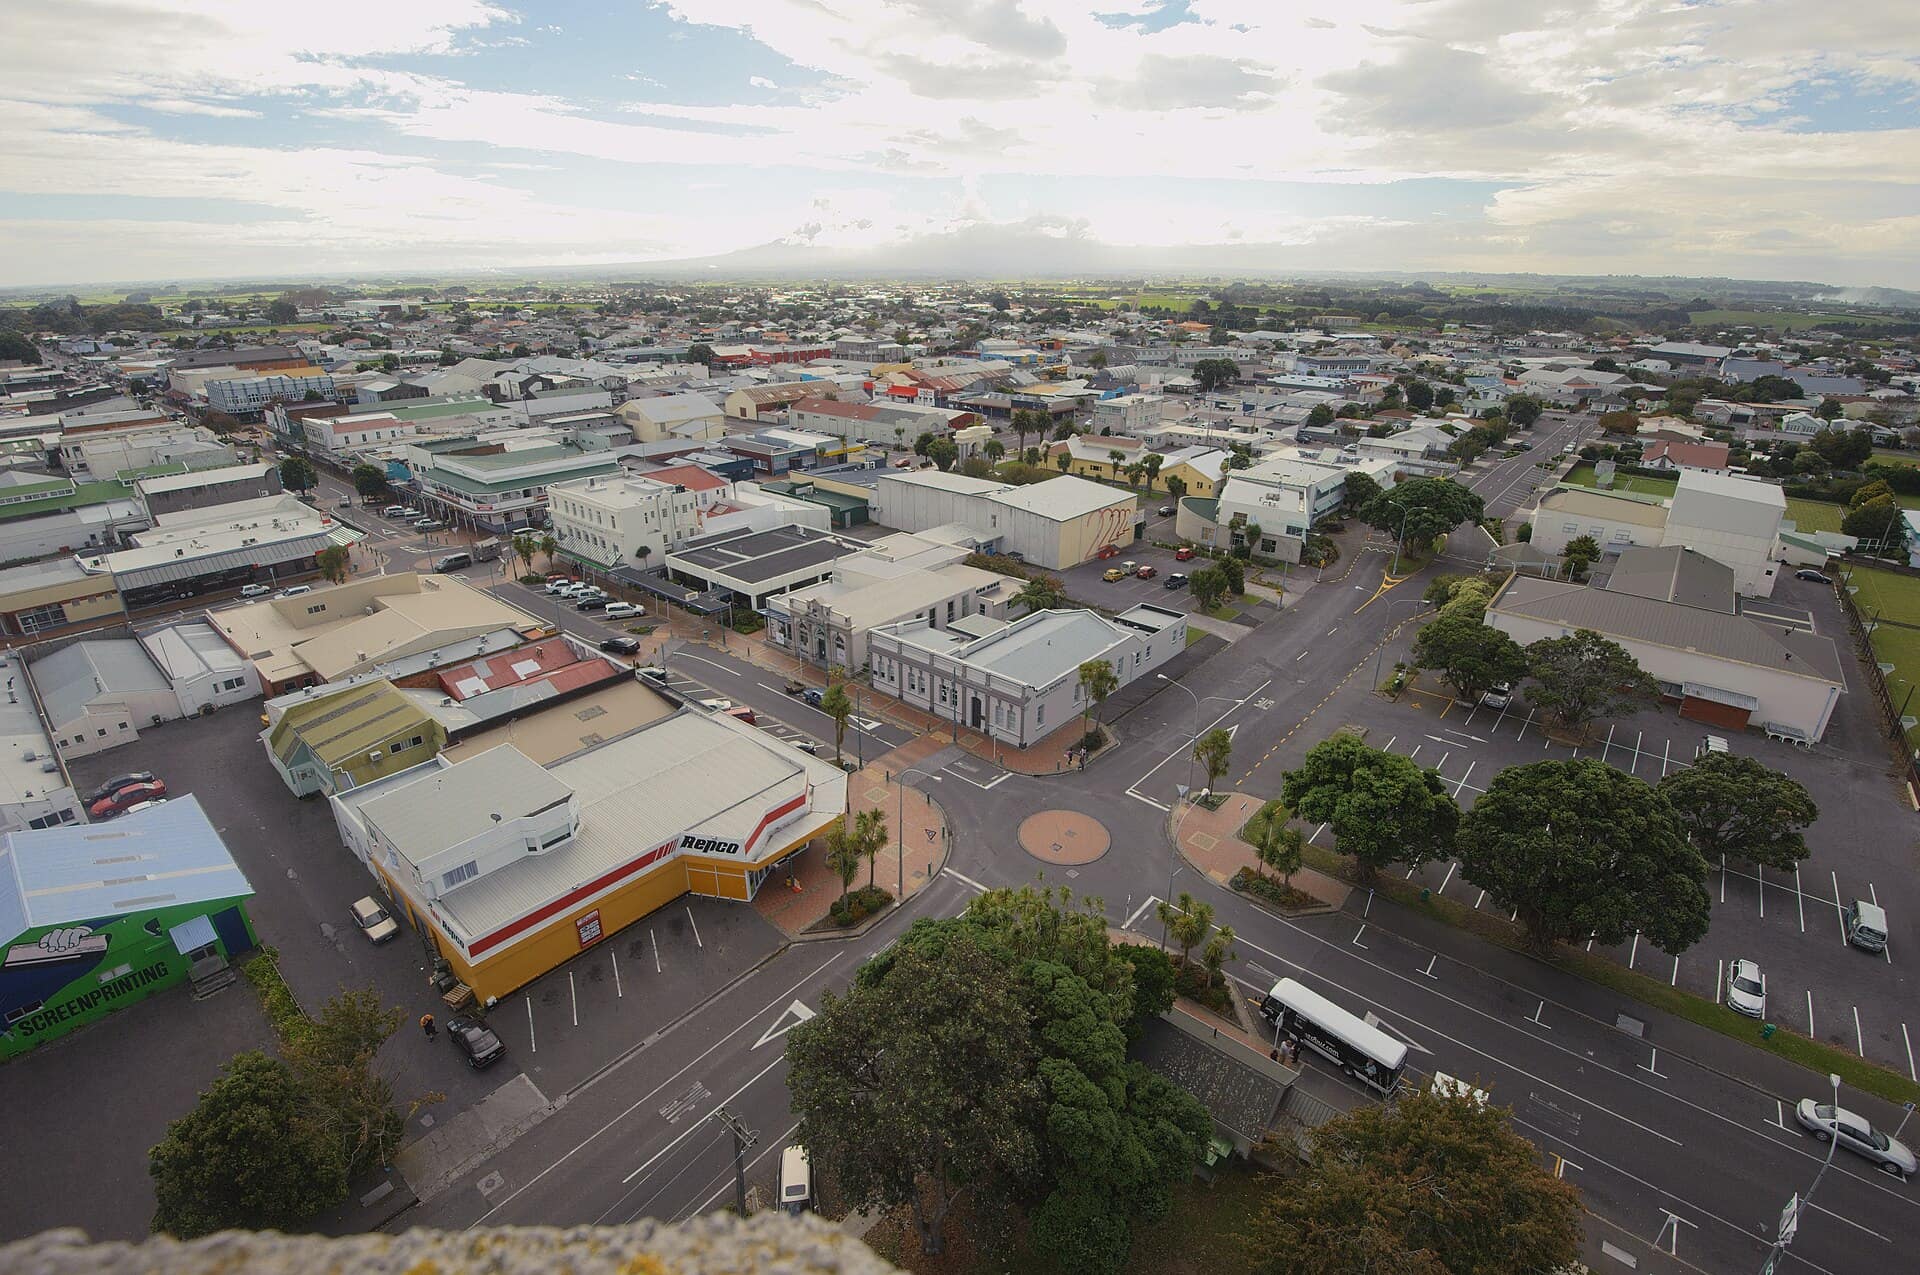
Property sold in Kaponga, Hāwera
Houses, townhouses, apartments and sections, farms and lifestyle blocks, and commercial and industrial sites sold in Kaponga, Hāwera in the last twelve months, latest first, with the price where it is public beside the council valuation.
3 properties sold in the last 12 months in Kaponga


About Kaponga
About 1% of its homes sold in the last twelve months.
Schools zoned for Kaponga
- Matapu Schoolprimary · Years 1-8
- Kaponga Schoolprimary · Years 1-8
- St Patrick's School (Kaponga)primary · Years 1-8
Kaponga house prices over time
Median sale price by year, all homes; 2026 is the year so far. Across Hāwera it was $493k.
Sales by year as a table
| Year | Sales | Median price | Per m² floor | Per m² land (est.) | Hāwera median |
|---|---|---|---|---|---|
| 2026 | 3 | — | — | — | $500,000 |
| 2025 | 7 | $313,000 | $3,100 | $132 | $475,000 |
| 2024 | 3 | — | — | — | $455,000 |
| 2023 | 1 | — | — | — | $480,000 |
| 2022 | 9 | $310,000 | $2,552 | $104 | $489,000 |
| 2021 | 8 | $343,000 | $3,259 | $88 | $421,775 |
| 2020 | 7 | $211,000 | $2,000 | $73 | $330,000 |
| 2019 | 6 | $168,250 | $1,337 | $53 | $265,000 |
| 2018 | 8 | $152,000 | $1,232 | $51 | $235,000 |
| 2017 | 8 | $130,000 | $1,103 | $39 | $230,000 |
| 2016 | 7 | $220,000 | $1,292 | $28 | $225,000 |
Estimated value, month by month
Our model's median estimate for homes in Kaponga, level over the last twelve months. An automated estimate, not a registered valuation.
Prices by bedrooms in Kaponga
| Bedrooms | Homes | Median council value | Sold, last 12 months | Median sale | Per m² floor |
|---|---|---|---|---|---|
| 2 | 6 | $178k | 0 | — | $2,928 |
| 3 | 133 | $290k | 2 | — | $2,500 |
| 4 | 14 | $488k | 0 | — | $2,207 |
| 5+ | 5 | $550k | 0 | — | $1,780 |
Price per square metre
Recent sales in Kaponga
- 1491 Eltham Road$535,00027 Mar 2026 · 3 bed · 100 m² floor · 5,641 m² land
- 4 Fitzgerald Avenue$380,0009 Mar 2026 · 3 bed · 100 m² floor · 699 m² land
- 673 Palmer Road$410,00019 Jan 2026 · 166 m² floor · 2,460 m² land
- 6 Fitzgerald Avenue$112,0002 Sept 2025 · 3 bed · 121 m² floor · 699 m² land
- 86 Victoria Street$400,00017 Jun 2025 · 4 bed · 210 m² floor · 4,097 m² land
- 4 Victoria Street$450,0006 May 2025 · 3 bed · 100 m² floor · 703 m² land
- 16 Egmont Street$313,0008 Apr 2025 · 3 bed · 75 m² floor · 697 m² land
- 29 Park Lane$365,0004 Apr 2025 · 3 bed · 101 m² floor · 1,012 m² land
- 4 Egmont Street$310,00031 Mar 2025 · 3 bed · 100 m² floor · 856 m² land
- 31 Park Lane$290,00021 Jan 2025 · 101 m² floor · 14,855 m² land
- 8 Riverside Drive$445,75026 Nov 2024 · 3 bed · 120 m² floor · 1,133 m² land
- 74 Egmont Street$330,00010 Oct 2024 · 3 bed · 93 m² floor · 1,104 m² land
How long owners stay in Kaponga
Time between a home's sales, for homes that resold in the last five years. A home not sold since our records begin is not counted, so owners who stay longest are under-represented.
Who lives in Kaponga
About 789 people lived in Kaponga at the 2023 census (up 8% since 2018); their median age was about 40 (Hāwera: 40); 58% of households owned their home (Hāwera: 68%).
Age
- 30-64 years50%
- Under 15 years23%
- 15-29 years17%
- 65 years and over12%
Households
- One-family household (with or without other people)66%
- One-person household28%
- Other multi-person household4%
- Two-family household (with or without other people)3%
- Three or more family household (with or without other people)0%
Ethnicity
- European86%
- Māori24%
- Asian3%
- Pacific Peoples3%
- Other Ethnicity1%
- Middle Eastern/Latin American/African0%
Where people were born
- New Zealand92%
- Asia3%
- United Kingdom and Ireland2%
- Australia2%
- Middle East and Africa1%
- Europe (excl United Kingdom and Ireland)1%
- North America0%
- Other0%
Household income
- $100,001-$150,00021%
- $70,001-$100,00016%
- $50,001-$70,00014%
- $30,001-$50,00013%
- $200,001 or more12%
- $20,001-$30,00011%
- $150,001-$200,00011%
- $20,000 or less8%
Dwellings
- Separate house93%
- Joined dwelling4%
- Other private dwelling2%
- Non-private dwelling0%
Highest qualification
- No qualification29%
- Level 1 certificate18%
- Level 2 certificate15%
- Level 3 certificate13%
- Level 4 certificate9%
- Bachelor degree and Level 7 qualification5%
- Level 5 diploma4%
- Level 6 diploma3%
Stats NZ Census 2023 and 2018, summed over the census areas inside Kaponga. Medians are approximate: Stats NZ publishes them per area and they cannot be added up exactly.
Real estate agents selling in Kaponga
10 agents have been credited on a sale or a live listing in Kaponga in the last two years. Those with the most:
- Scott RobertsMetcalfe Real Estate2 sales here
- Kyle BatesMcDonald Real Estate Limited1 sale here
- Kirsten KiernanCollective First National Hawera1 sale here
- Alison SmithSmith + Bishop1 sale here
- Simon BendallMetcalfe Real Estate1 sale here
- Gregory BruntonBayleys Hawera1 sale here
- Lorraine BruntonBayleys Hawera1 sale here
- Hayley ShawCollective First National Hawera1 sale here
- Sharna CaskeyMetcalfe Real Estate1 sale here
- Rebecca BruceMcDonald Real Estate Limited1 sale here
All 10 real estate agents in Kaponga, with their recent sales and which agencies sell the suburb.
Counted from sales records that name the agent, and from current listings. A count of activity, not a rating.
Building and resource consents in Kaponga
- 32 Egmont Street1 Apr 2026 · Building consentNew bdrm, living & single gge add to existing three bdrm dwg
- 6 Riverside Drive1 Mar 2026 · Building consentInstall inbuilt yunca xander ca logfire
- 3 Alamein Street1 Feb 2026 · Building consentInstall firenzo viking f/stdg logfire
Search building consents in Kaponga and see Stats NZ's count of new homes there.
Sales and valuations as at 18 September 2026, from council and LINZ records. Figures resting on fewer than 5 sales are not shown.
Property sold by street in Kaponga
About property sold in Kaponga, Hāwera
Every property in Kaponga, Hāwera, whether it is for sale or not: homes, sections, farms, lifestyle blocks, shops, offices and industrial land. Each is listed from the council rating roll and Toitū Te Whenua LINZ, with the listing beside it when an agent is marketing it.
Sales come from the council valuation roll and the listings that preceded them. Each opens on the property’s own page, with its full sales history, our estimate of its value today and its title.
Each property has its own page: our estimate of its value beside the council rating valuation, past sale prices, the title and land area, zoning and hazards, building consents, and what it would cost to own.
Listings are published by the agents who market them. Addresses, land details and rating valuations come from Toitū Te Whenua Land Information New Zealand and from the council. No ownership information is published.