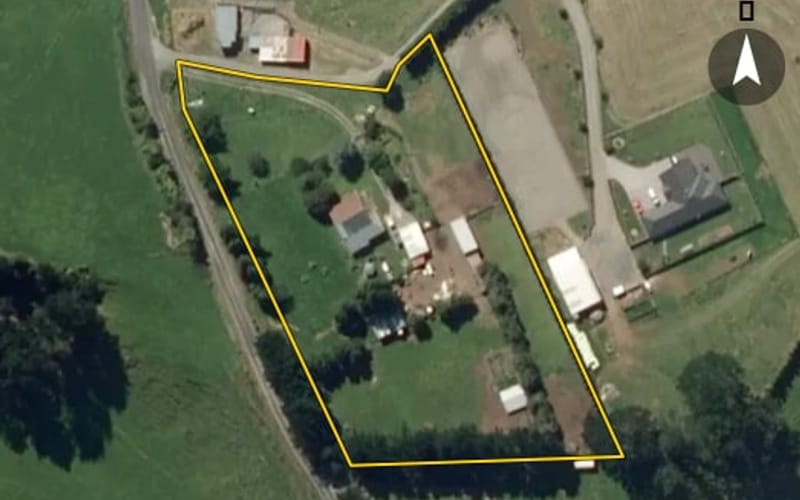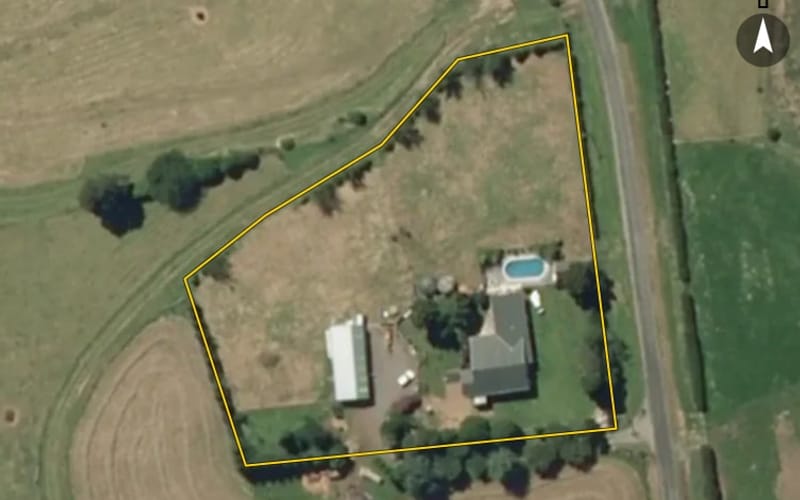
2 properties sold · New Plymouth

Property sold in Tarurutangi, New Plymouth

Houses, townhouses, apartments and sections, farms and lifestyle blocks, and commercial and industrial sites sold in Tarurutangi, New Plymouth in the last twelve months, latest first, with the price where it is public beside the council valuation.

$1.08mmedian council valuation
0for sale now
New PlymouthTarurutangi ×

2 properties sold in the last 12 months in Tarurutangi

About Tarurutangi

About 1.2% of its homes sold in the last twelve months.

Schools zoned for Tarurutangi

  • Lepperton Schoolprimary · Years 1-8
  • Bell Block Schoolprimary · Years 1-8
  • Egmont Village Schoolprimary · Years 1-8
  • Inglewood Primary Schoolprimary · Years 1-8
  • Highlands Intermediateintermediate · Years 7-8
  • Inglewood High Schoolsecondary · Years 9-15

Tarurutangi house prices over time

Median sale price by year, all homes; 2026 is the year so far. Across New Plymouth it was $709k.

2016: $500k (9 sales)$500k20162017: $909k (7 sales)2018: $688k (8 sales)20182019: $680k (7 sales)2020: too few sales to say (3 sales)20202021: $810k (6 sales)2022: too few sales to say (2 sales)20222023: $988k (6 sales)2024: $1.02m (6 sales)$1.02m20242025: too few sales to say (3 sales)2026: too few sales to say (2 sales, this year so far)2026
Sales by year as a table
YearSalesMedian pricePer m² floorPer m² land (est.)New Plymouth median
20262———$710,000
20253———$700,000
20246$1,025,000$4,539$78$710,000
20236$987,500$5,746$75$690,000
20222———$725,000
20216$810,000$5,745$29$670,000
20203———$510,000
20197$680,000$3,886$59$445,000
20188$687,500$3,344$21$432,250
20177$909,000$3,977$25$407,000
20169$500,000$2,900$44$377,000

Estimated value, month by month

Our model's median estimate for homes in Tarurutangi, down 3% over the last twelve months. An automated estimate, not a registered valuation.

Nov 2024: $1.08mDec 2024: $1.08mJan 2025: $1.09mFeb 2025: $1.08mMar 2025: $1.08mApr 2025: $1.09mMay 2025: $1.09mJun 2025: $1.09mJul 2025: $1.09mAug 2025: $1.09mSept 2025: $1.09mOct 2025: $1.09mNov 2025: $1.1mDec 2025: $1.1mJan 2026: $1.1mFeb 2026: $1.1mMar 2026: $1.1mApr 2026: $1.09mMay 2026: $1.08mJun 2026: $1.07mJul 2026: $1.07mAug 2026: $1.07mSept 2026: $1.07mOct 2026: $1.06m$1.08m$1.1m$1.06mNov 2024Oct 2026
Scale $1.05m to $1.11m, not from zero.

Prices by bedrooms in Tarurutangi

BedroomsHomesMedian council valueSold, last 12 monthsMedian salePer m² floor
335$940k2—$6,631
454$1.23m0—$5,355
5+17$1.63m0—$4,410

Price per square metre

$5,348per m² of floor, council capital values
$42per m² of land, council land values of houses

Recent sales in Tarurutangi

How long owners stay in Tarurutangi

8.3 yearsNew Plymouth
7.9 yearsNew Zealand
1.2%of homes sold in the last 12 months (New Plymouth: 4%)

Time between a home's sales, for homes that resold in the last five years. A home not sold since our records begin is not counted, so owners who stay longest are under-represented.

Who lives in Tarurutangi

About 501 people lived in Tarurutangi at the 2023 census (up 5% since 2018); their median age was about 44 (New Plymouth: 42); 80% of households owned their home (New Plymouth: 72%).

501people, 2023 (2018: 477)
44median age, about (New Plymouth: 42)
$117kmedian household income, about (New Plymouth: $91k)
80%of households own their home (2018: 88%)

Age

  • 30-64 years48%
  • Under 15 years22%
  • 65 years and over16%
  • 15-29 years14%

Households

  • One-family household (with or without other people)82%
  • One-person household16%
  • Other multi-person household0%
  • Two-family household (with or without other people)0%
  • Three or more family household (with or without other people)0%

Ethnicity

  • European94%
  • Māori5%
  • Pacific Peoples2%
  • Asian2%
  • Other Ethnicity1%
  • Middle Eastern/Latin American/African1%

Where people were born

  • New Zealand83%
  • United Kingdom and Ireland8%
  • Middle East and Africa2%
  • Australia2%
  • Asia1%
  • Europe (excl United Kingdom and Ireland)1%
  • Pacific Islands1%
  • Other0%

Household income

  • $100,001-$150,00023%
  • $200,001 or more21%
  • $70,001-$100,00014%
  • $150,001-$200,00014%
  • $50,001-$70,00011%
  • $30,001-$50,0009%
  • $20,001-$30,0007%
  • $20,000 or less4%

Dwellings

  • Separate house89%
  • Joined dwelling8%
  • Non-private dwelling0%
  • Other private dwelling0%

Highest qualification

  • No qualification15%
  • Level 1 certificate14%
  • Level 3 certificate13%
  • Level 4 certificate13%
  • Bachelor degree and Level 7 qualification12%
  • Level 2 certificate9%
  • Level 5 diploma8%
  • Post-graduate and honours degrees6%

Stats NZ Census 2023 and 2018, summed over the census areas inside Tarurutangi. Medians are approximate: Stats NZ publishes them per area and they cannot be added up exactly.

Real estate agents selling in Tarurutangi

5 agents have been credited on a sale or a live listing in Tarurutangi in the last two years. Those with the most:

All 5 real estate agents in Tarurutangi, with their recent sales and which agencies sell the suburb.

Counted from sales records that name the agent, and from current listings. A count of activity, not a rating.

Building and resource consents in Tarurutangi

3building consents in the last 12 months ($222k of work)
  • 221 Awai Road1 Mar 2026 · Building consentConstruction of a new stand alone 1-bdrm granny flat on the existing site.
  • 156 Hursthouse Road1 Feb 2026 · Building consentReplace existing (damaged )jotul f500 woodburning stove + wb with new metro xtreme rad Ltd +4kw wb.
  • 139 Manutahi Road1 Jan 2026 · Building consentRes/farm - removing internal wall, new truss to support roof, location of kitchen changing

Search building consents in Tarurutangi and see Stats NZ's count of new homes there.

Sales and valuations as at 18 September 2026, from council and LINZ records. Figures resting on fewer than 5 sales are not shown.

Property sold by street in Tarurutangi

About property sold in Tarurutangi, New Plymouth

Every property in Tarurutangi, New Plymouth, whether it is for sale or not: homes, sections, farms, lifestyle blocks, shops, offices and industrial land. Each is listed from the council rating roll and Toitū Te Whenua LINZ, with the listing beside it when an agent is marketing it.

Sales come from the council valuation roll and the listings that preceded them. Each opens on the property’s own page, with its full sales history, our estimate of its value today and its title.

Each property has its own page: our estimate of its value beside the council rating valuation, past sale prices, the title and land area, zoning and hazards, building consents, and what it would cost to own.

Listings are published by the agents who market them. Addresses, land details and rating valuations come from Toitū Te Whenua Land Information New Zealand and from the council. No ownership information is published.

Header photo: Simon Infanger on Unsplash (licence).