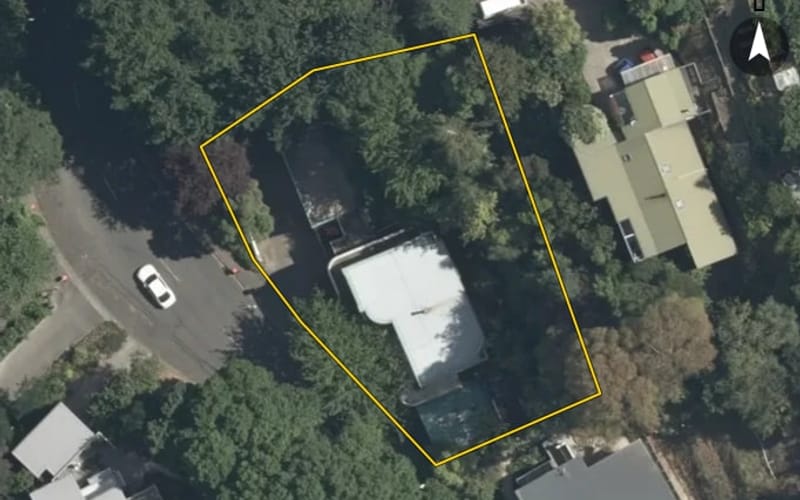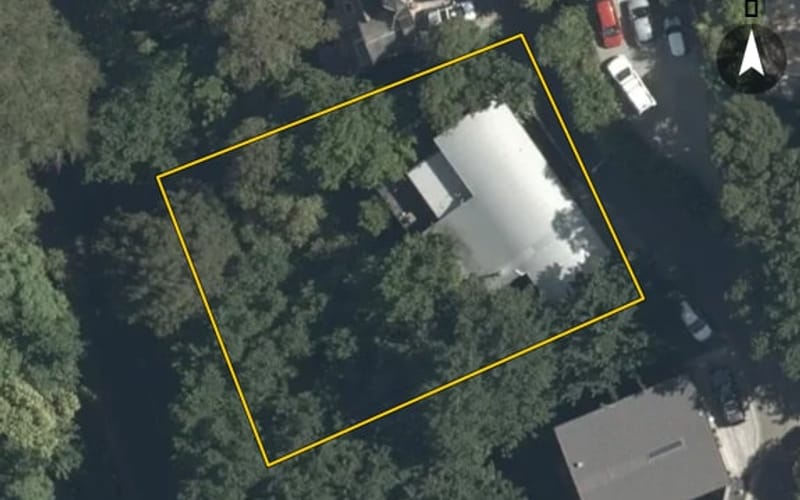
56 properties · Hospital Hill, Napier

Burns Road, Hospital Hill

Burns Road in Hospital Hill has 56 properties, valued by the council between $51,000 and $1,360,000 with a median of $680,000 (Hospital Hill: $850,000). More of its homes were built in the 1970s than in any other decade. We estimate its homes at a median $653,000. 1 sold in the last twelve months. The highest sale in 2026 was 19 Burns Road, at $515,000.

$680kmedian council valuation
$653kour median estimate
1sold in the last 12 months
1965median year built
NapierHospital Hill ×Burns Road ×

56 properties on Burns Road, Hospital Hill

Highest and lowest on Burns Road

Highest-valued home35 Burns Road$1,360,000council valuation · 4 bed · 265 m² floor · 819 m² land
Lowest-valued home8A Burns Road$51,000council valuation · 127 m² land
Highest sale in 202619 Burns Road$515,000sold 16 Jul 2026 · 3 bed · 177 m² floor · 966 m² land

Property values on Burns Road

The council values Burns Road's 54 rated properties between $51,000 and $1,360,000. The middle half sit between about $570,000 and $794,500; the median is $680,000 and the mean $681,870.

Lowest: $51k$51kLowest10%: $455k20%: $550k20%30%: $590k40%: $642k40%Median: $680k60%: $698k60%70%: $771k80%: $818k80%90%: $941kHighest: $1.36m$1.36mHighest
BedroomsHomesMedian council valueSold, last 12 monthsMedian sale
214$550k0—
325$680k1—
412$860k0—
5+1$860k0—

Council rating valuations: the council's figure for apportioning rates, not a market appraisal.

Burns Road compared with Hospital Hill

Burns Road's median council value is 20% below Hospital Hill's.

Burns RoadHospital HillNapier
Median council value$680k$850k$700k
Sold in the last 12 months1.8%2.6%3.5%
Time between sales12.4 yrs9.9 yrs8.6 yrs
Median section802 m²696 m²682 m²
Median year built196519401970
Council value per m² of floor$5k$5k$5k

Burns Road house prices over time

Median sale price by year; 2026 is the year so far. A year with fewer than two sales has no bar.

2016: $369k (4 sales)$369k20162017: $522k (3 sales)2018: $535k (2 sales)20182019: $610k (7 sales)2020: $665k (8 sales)20202021: too few sales to say (1 sale)2022: $780k (6 sales)20222023: too few sales to say (1 sale)2024: too few sales to say (1 sale)20242025: $785k (3 sales)$785k2026: too few sales to say (1 sale, this year so far)2026
Sales by year as a table
YearSalesMedian pricePer m² floor
20261$515,000$2,910
20253$785,000$6,038
20241$477,000$4,867
20231$687,000$4,642
20226$780,000$6,612
20211$1,450,000$5,472
20208$665,000$4,704
20197$610,000$4,780
20182$535,000$4,038
20173$522,000$2,519
20164$368,500$3,716

Recent sales on Burns Road

  • 19 Burns Road$515,00016 Jul 2026 · 3 bed · 177 m² floor · 966 m² land
  • 35 Burns Road$1,230,00028 Jun 2025 · 4 bed · 265 m² floor · 819 m² land
  • 59 Burns Road$630,00012 Jun 2025 · 2 bed · 90 m² floor · 483 m² land
  • 51 Burns Road$785,00020 Jan 2025 · 3 bed · 130 m² floor · 1,141 m² land
  • 2/48 Burns Road$477,00010 Dec 2024 · 2 bed · 98 m² floor
  • 21 Burns Road$687,00024 May 2023 · 3 bed · 148 m² floor · 866 m² land
  • 4/48 Burns Road$550,0006 Sept 2022 · 2 bed · 98 m² floor
  • 15 Burns Road$810,00030 Jun 2022 · 3 bed · 120 m² floor · 655 m² land
  • 57 Burns Road$725,00021 Mar 2022 · 3 bed · 112 m² floor · 1,060 m² land
  • 8 Burns Road$1,200,00018 Feb 2022 · 3 bed · 105 m² floor · 557 m² land
  • 25 Burns Road$750,00024 Jan 2022 · 3 bed · 200 m² floor · 880 m² land
  • 61 Burns Road$975,00017 Jan 2022 · 3 bed · 120 m² floor · 529 m² land
  • 35 Burns Road$1,450,0003 Mar 2021 · 4 bed · 265 m² floor · 819 m² land
  • 29 Burns Road$970,00010 Dec 2020 · 2 bed · 135 m² floor · 885 m² land
  • 19 Burns Road$580,00026 Nov 2020 · 3 bed · 177 m² floor · 966 m² land
  • 39A Burns Road$610,0005 Nov 2020 · 2 bed · 142 m² floor · 574 m² land
  • 5/48 Burns Road$260,0002 Oct 2020 · 3 bed · 98 m² floor
  • 2/48 Burns Road$501,0006 Aug 2020 · 2 bed · 98 m² floor
  • 22 Burns Road$720,0003 Aug 2020 · 3 bed · 120 m² floor · 1,322 m² land
  • 26 Burns Road$745,00026 Jun 2020 · 5 bed · 280 m² floor · 1,257 m² land

The homes on Burns Road

Burns Road has 47 houses, 6 units and townhouses and 1 apartment. More were built in the 1970s than in any other decade (23%).

1900s: 1 (1 home)11900s1910s: 2 (2 homes)1920s: 9 (9 homes)1920s1930s: 2 (2 homes)1940s: 3 (3 homes)1940s1950s: 8 (8 homes)1960s: 1 (1 home)1960s1970s: 12 (12 homes)121980s: 9 (9 homes)1980s2000s: 2 (2 homes)2010s: 3 (3 homes)32010s

How long owners stay on Burns Road

Homes on Burns Road that resold in the last five years had been held a median 12.4 years (Hospital Hill: 9.9 years).

Time between a home's sales, for 10 resales in the last five years. A home not sold since our records begin is not counted, so owners who stay longest are under-represented.

Building and resource consents on Burns Road

4building consents in the last 5 years
  • 50 Burns Road1 Mar 2023 · Building consentRelocate 1 x bdrm tiny home to site
  • 31 Burns Road1 Feb 2023 · Building consentRetaining wall & car parking
  • 5 Burns Road1 Aug 2022 · Building consentBuild new retaining wall
  • 55 Burns Road1 Aug 2022 · Building consentReplace 2 doors & windows, realign internal walls, remodel kitchen & bathrm

Burns Road in other suburbs

Sales and valuations as at 11 September 2026, from council and LINZ records. Medians resting on fewer than 3 sales are not shown.