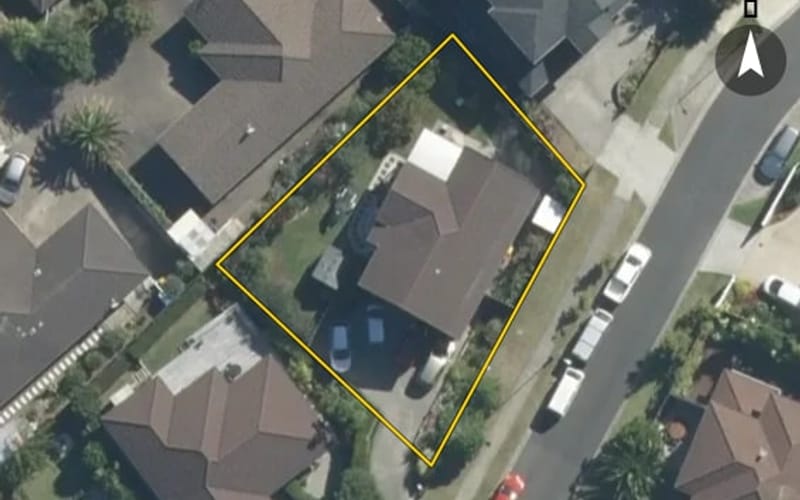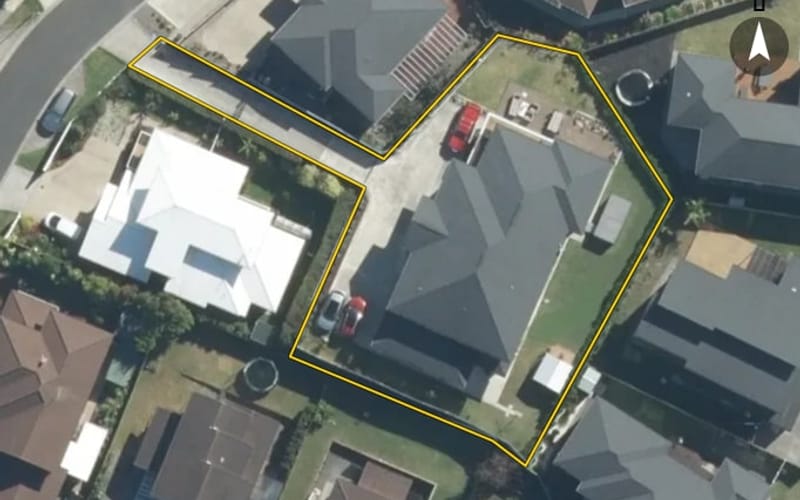
Spyglass Street, Red Beach
Spyglass Street in Red Beach has 24 properties, valued by the council between $1,250,000 and $2,250,000 with a median of $1,625,000 (Red Beach: $1,175,000). Most of its homes were built in the 2010s. We estimate its homes at a median $1,610,000. The last sale we have was in March 2025, for $1,580,000.
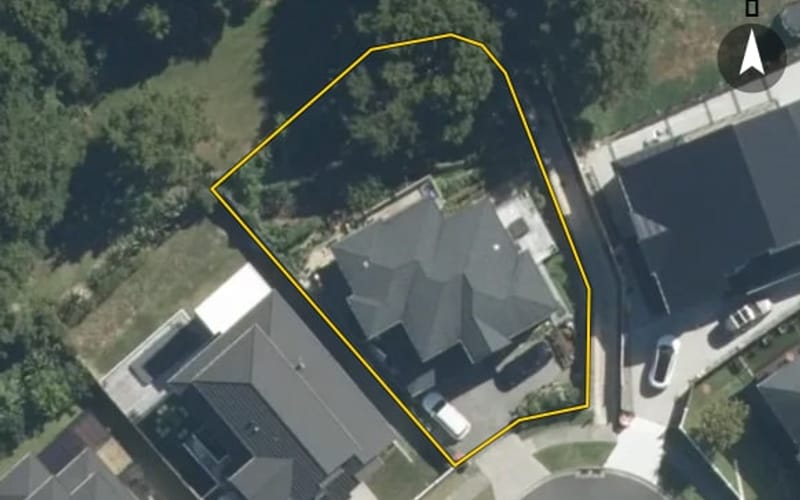
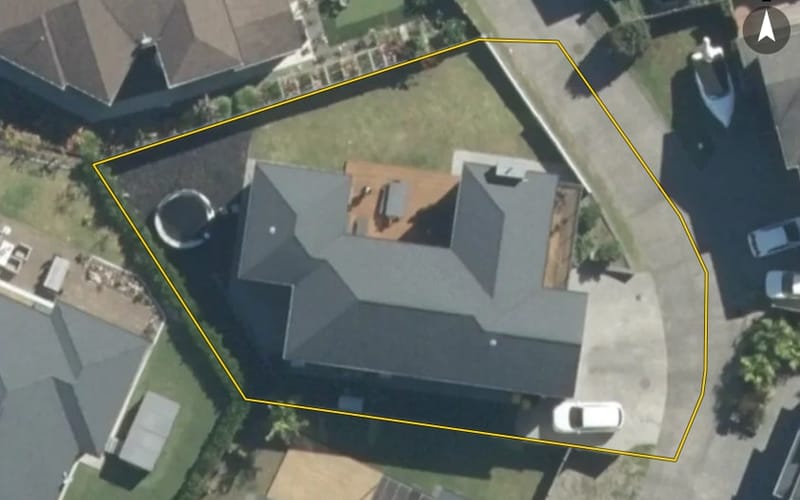
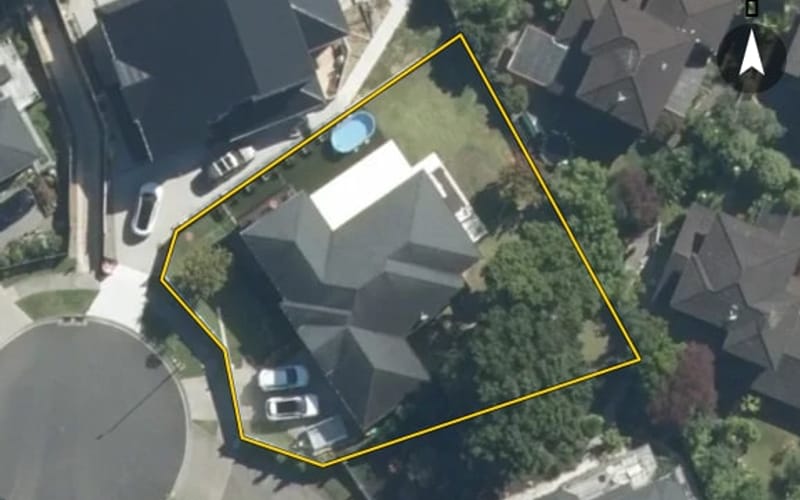
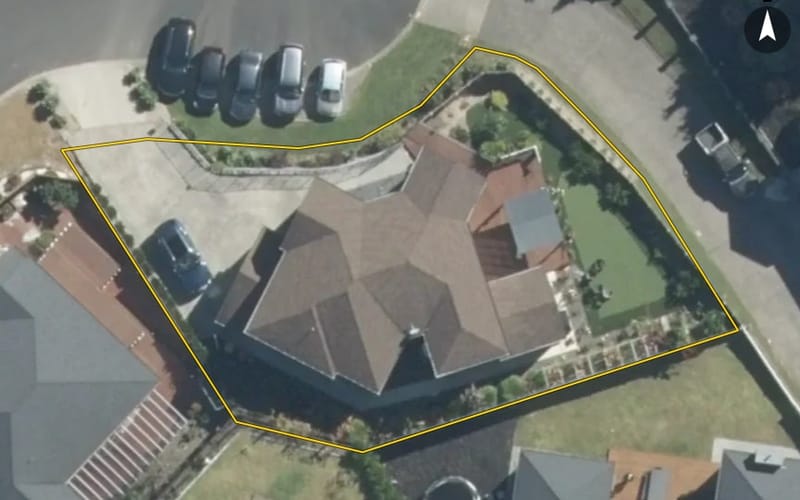
24 properties on Spyglass Street, Red Beach


Highest and lowest on Spyglass Street
Property values on Spyglass Street
The council values Spyglass Street's 23 rated properties between $1,250,000 and $2,250,000. The middle half sit between about $1,490,000 and $1,687,500; the median is $1,625,000 and the mean $1,610,870.
| Bedrooms | Homes | Median council value | Sold, last 12 months | Median sale |
|---|---|---|---|---|
| 4 | 7 | $1.25m | 0 | — |
| 5+ | 15 | $1.65m | 0 | — |
Council rating valuations: the council's figure for apportioning rates, not a market appraisal.
Spyglass Street compared with Red Beach
Spyglass Street's median council value is 38% above Red Beach's.
| Spyglass Street | Red Beach | Whangaparāoa | |
|---|---|---|---|
| Median council value | $1.63m | $1.18m | $1.02m |
| Median section | 625 m² | 674 m² | 809 m² |
| Median year built | 2010 | 1990 | 1990 |
| Council value per m² of floor | $5k | $7k | $6k |
Spyglass Street house prices over time
Median sale price by year; 2025 is the year so far. A year with fewer than two sales has no bar.
Sales by year as a table
| Year | Sales | Median price | Per m² floor |
|---|---|---|---|
| 2025 | 1 | $1,580,000 | $4,020 |
| 2024 | 2 | $1,402,500 | $5,610 |
| 2022 | 2 | $2,120,000 | $6,952 |
| 2021 | 2 | $1,330,400 | $3,411 |
| 2020 | 5 | $1,290,500 | $3,814 |
| 2019 | 2 | $1,210,000 | $4,928 |
| 2018 | 5 | $1,400,000 | $4,003 |
| 2017 | 3 | $648,000 | $2,190 |
| 2016 | 2 | $1,177,500 | $3,471 |
Recent sales on Spyglass Street
- 20 Spyglass Street$1,580,00010 Mar 2025 · 6 bed · 393 m² floor · 618 m² land
- 5 Spyglass Street$1,280,00017 Aug 2024 · 4 bed · 194 m² floor · 554 m² land
- 13 Spyglass Street$1,525,00027 Jul 2024 · 6 bed · 330 m² floor · 600 m² land
- 21 Spyglass Street$2,000,00012 Feb 2022 · 5 bed · 287 m² floor · 878 m² land
- 12 Spyglass Street$2,240,00010 Jan 2022 · 5 bed · 323 m² floor · 541 m² land
- 19 Spyglass Street$960,00016 Oct 2021 · 476 m² floor · 1,321 m² land
- 16 Spyglass Street$1,700,80012 May 2021 · 5 bed · 354 m² floor · 698 m² land
- 19 Spyglass Street$653,00024 Nov 2020 · 476 m² floor · 1,321 m² land
- 22 Spyglass Street$1,335,00031 May 2020 · 6 bed · 350 m² floor · 645 m² land
- 7 Spyglass Street$1,030,0001 May 2020 · 4 bed · 228 m² floor · 561 m² land
- 8 Spyglass Street$1,400,00010 Feb 2020 · 4 bed · 258 m² floor · 600 m² land
- 18 Spyglass Street$1,290,5008 Jan 2020 · 5 bed · 342 m² floor · 636 m² land
- 3 Spyglass Street$1,020,00022 Sept 2019 · 4 bed · 190 m² floor · 584 m² land
- 14 Spyglass Street$1,400,0006 Aug 2019 · 5 bed · 312 m² floor · 655 m² land
- 10 Spyglass Street$2,080,0008 Oct 2018 · 6 bed · 539 m² floor · 1,081 m² land
- 1 Spyglass Street$985,00016 Apr 2018 · 4 bed · 202 m² floor · 614 m² land
- 11 Spyglass Street$1,400,0004 Mar 2018 · 5 bed · 344 m² floor · 603 m² land
- 17 Spyglass Street$648,0002 Mar 2018 · 5 bed · 377 m² floor · 730 m² land
- 24 Spyglass Street$1,465,00014 Feb 2018 · 6 bed · 366 m² floor · 625 m² land
- 17 Spyglass Street$648,0003 Oct 2017 · 5 bed · 377 m² floor · 730 m² land
The homes on Spyglass Street
Spyglass Street has 24 houses. Most were built in the 2010s (83%).
Building and resource consents on Spyglass Street
- 19 Spyglass Street1 May 2022 · Building consentRbw - three-storey res dwg. 6-bedrooms, 6-baths 1-wc, 1-entertainment, 1-living, 1-kitchen-dining-family-scullery, 1-laundry, 1-pantry, 1-dbl gge. Max 2.0m h timber rtw. Total floor area 485m2.
More streets in Red Beach
- Whangaparaoa Road199
- Bay Street183
- Rosario Crescent136
- Hibiscus Coast Highway126
- Albatross Road104
- Marellen Drive102
- William Bayes Place100
- Walton Street96
- Red Beach Road95
- Symes Drive80
- Moffat Road78
- Pohutukawa Avenue71
Every street in Red Beach, and the suburb's house prices and sales.
Sales and valuations as at 11 September 2026, from council and LINZ records. Medians resting on fewer than 3 sales are not shown.