28 properties · Stanmore Bay, Whangaparāoa

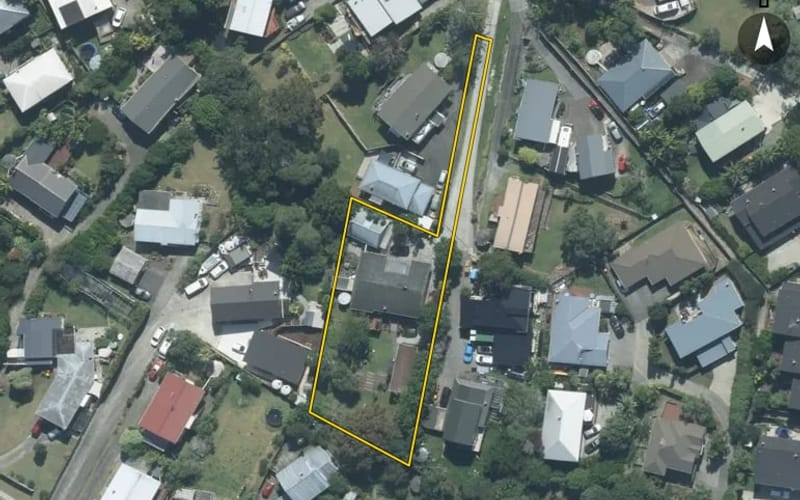
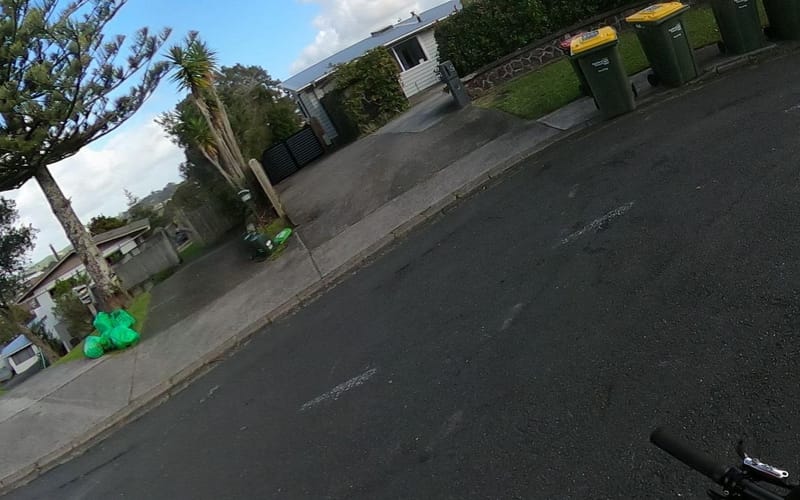
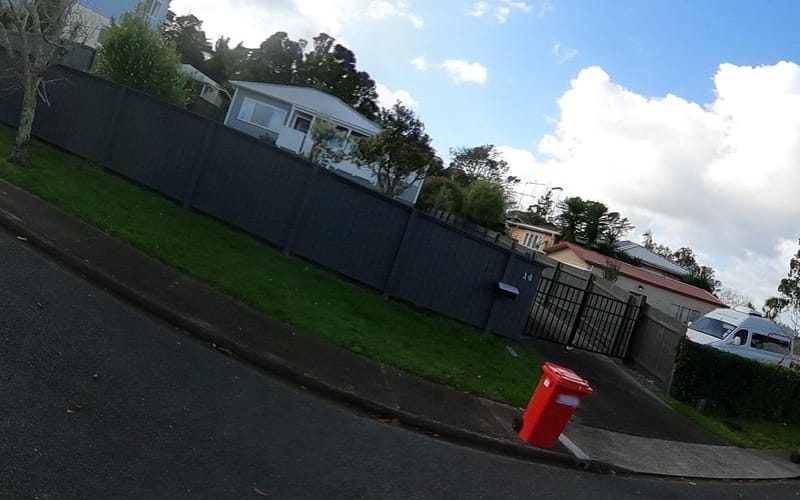
John Road, Stanmore Bay

John Road in Stanmore Bay has 28 properties, valued by the council between $390,000 and $1,200,000 with a median of $860,000 (Stanmore Bay: $920,000). More of its homes were built in the 1970s than in any other decade. We estimate its homes at a median $871,000. 2 sold in the last twelve months. The highest sale in 2026 was 20 John Road, at $1,247,500.
$860kmedian council valuation
$871kour median estimate
2sold in the last 12 months
1970median year built
WhangaparāoaStanmore Bay ×John Road ×

28 properties on John Road, Stanmore Bay

Highest and lowest on John Road

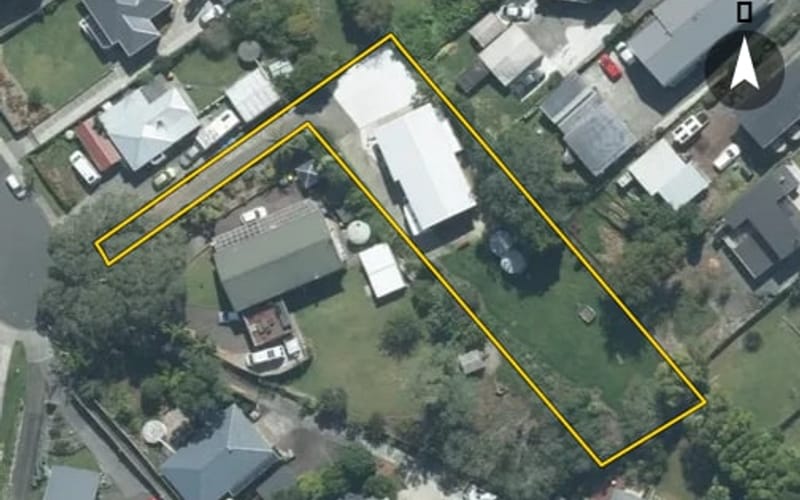
Highest-valued home18 John Road$1,200,000council valuation · 3 bed · 181 m² floor · 1,442 m² land
Lowest-valued home21A John Road$390,000council valuation · 777 m² land
Highest sale in 202620 John Road$1,247,500sold 1 Jun 2026 · 5 bed · 241 m² floor · 1,803 m² land

Property values on John Road

The council values John Road's 27 rated properties between $390,000 and $1,200,000. The middle half sit between about $744,000 and $914,000; the median is $860,000 and the mean $856,852.

Lowest: $390k$390kLowest10%: $680k20%: $718k20%30%: $770k40%: $816k40%Median: $860k60%: $880k60%70%: $900k80%: $928k80%90%: $1.16mHighest: $1.2m$1.2mHighest
BedroomsHomesMedian council valueSold, last 12 monthsMedian sale
24$903k0—
313$840k0—
48$885k1—
5+1$1.2m1—

Council rating valuations: the council's figure for apportioning rates, not a market appraisal.

John Road compared with Stanmore Bay

John Road's median council value is 7% below Stanmore Bay's.

John RoadStanmore BayWhangaparāoa
Median council value$860k$920k$1.02m
Sold in the last 12 months7.1%4.7%4.7%
Median section837 m²809 m²809 m²
Median year built197019901990
Council value per m² of floor$7k$6k$6k

John Road house prices over time

Median sale price by year; 2026 is the year so far. A year with fewer than two sales has no bar.

2016: $730k (3 sales)$730k2017: $780k (3 sales)20172018: too few sales to say (1 sale)2019: $622k (3 sales)20192020: $720k (4 sales)2021: too few sales to say (1 sale)20212022: $1.14m (2 sales)$1.14m2023: too few sales to say (1 sale)20232025: $884k (2 sales)2026: $1.02m (2 sales, this year so far)$1.02m2026
Sales by year as a table
YearSalesMedian pricePer m² floor
20262$1,023,750$6,510
20252$884,000$9,034
20231$1,201,000$8,340
20222$1,135,000$9,027
20211$830,000$12,206
20204$720,000$7,631
20193$622,000$5,032
20181$641,770$7,293
20173$780,000$5,490
20163$730,000$5,679

Recent sales on John Road

  • 20 John Road$1,247,5001 Jun 2026 · 5 bed · 241 m² floor · 1,803 m² land
  • 23 John Road$800,0005 Feb 2026 · 4 bed · 102 m² floor · 833 m² land
  • 11A John Road$660,00012 Jun 2025 · 2 bed · 65 m² floor
  • 10 John Road$1,108,00015 May 2025 · 4 bed · 140 m² floor · 847 m² land
  • 19 John Road$1,201,0002 Mar 2023 · 2 bed · 144 m² floor · 1,449 m² land
  • 9 John Road$920,0002 Aug 2022 · 3 bed · 106 m² floor · 837 m² land
  • 19 John Road$1,350,0001 Jul 2022 · 2 bed · 144 m² floor · 1,449 m² land
  • 13A John Road$830,00015 Jul 2021 · 3 bed · 68 m² floor
  • 9 John Road$715,0004 May 2020 · 3 bed · 106 m² floor · 837 m² land
  • 15 John Road$800,00018 Mar 2020 · 3 bed · 113 m² floor · 898 m² land
  • 17A John Road$720,00022 Feb 2020 · 3 bed · 88 m² floor · 600 m² land
  • 17A John Road$720,00020 Jan 2020 · 3 bed · 88 m² floor · 600 m² land
  • 14 John Road$473,00017 Oct 2019 · 3 bed · 94 m² floor · 883 m² land
  • 22 John Road$622,00028 Mar 2019 · 3 bed · 116 m² floor
  • 20 John Road$1,015,00020 Mar 2019 · 5 bed · 241 m² floor · 1,803 m² land
  • 17A John Road$641,77025 Oct 2018 · 3 bed · 88 m² floor · 600 m² land
  • 21A John Road$420,00021 Aug 2017 · 777 m² land
  • 19 John Road$990,00013 Aug 2017 · 2 bed · 144 m² floor · 1,449 m² land
  • 1 John Road$780,00022 Jun 2017 · 4 bed · 190 m² floor · 822 m² land
  • 10 John Road$795,0003 Aug 2016 · 4 bed · 140 m² floor · 847 m² land

The homes on John Road

John Road has 21 houses, 6 units and townhouses and 1 section. More were built in the 1970s than in any other decade (23%).

1940s: 1 (1 home)11940s1950s: 4 (4 homes)1950s1960s: 3 (3 homes)1960s1970s: 6 (6 homes)61970s1980s: 6 (6 homes)1980s1990s: 6 (6 homes)61990s

Building and resource consents on John Road

2resource consents in the last 5 years
  • 18 John Road13 Mar 2024 · Resource consentProposed extension of the lapse period of the land use and subdivision consents from 5 years to 9 years with a new lapse date of 18 March 2028.
  • 18 John Road13 Mar 2024 · Resource consentProposed extension of the lapse period of the land use and subdivision consents from 5 years to 9 years with a new lapse date of 18 March 2028.

Sales and valuations as at 11 September 2026, from council and LINZ records. Medians resting on fewer than 3 sales are not shown.