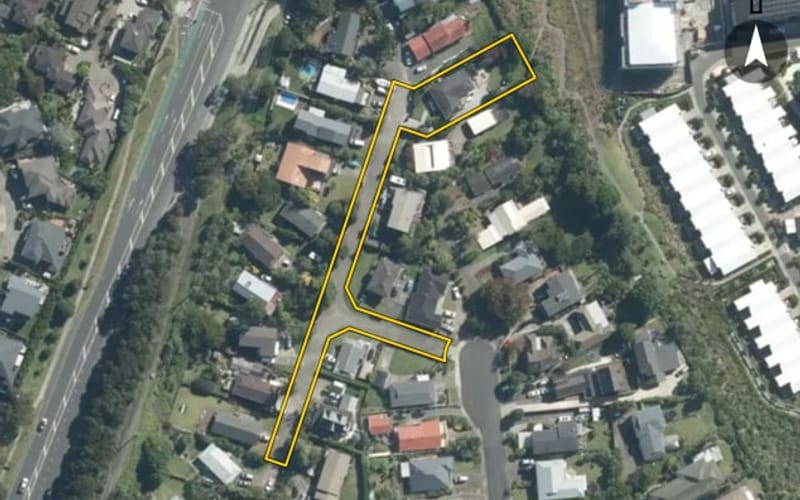
John Dee Crescent, Red Beach
John Dee Crescent in Red Beach has 66 properties, valued by the council between $770,000 and $1,475,000 with a median of $1,025,000 (Red Beach: $1,175,000). More of its homes were built in the 1980s than in any other decade. We estimate its homes at a median $988,000. 6 sold in the last twelve months, for a median $1,033,500. The highest sale in 2026 was 57 John Dee Crescent, at $1,165,000.
66 properties on John Dee Crescent, Red Beach


Highest and lowest on John Dee Crescent
Property values on John Dee Crescent
The council values John Dee Crescent's 64 rated properties between $770,000 and $1,475,000. The middle half sit between about $943,000 and $1,080,000; the median is $1,025,000 and the mean $1,021,328.
| Bedrooms | Homes | Median council value | Sold, last 12 months | Median sale |
|---|---|---|---|---|
| 2 | 3 | $770k | 0 | — |
| 3 | 24 | $970k | 4 | $933k |
| 4 | 30 | $1.02m | 2 | — |
| 5+ | 5 | $1.15m | 0 | — |
Council rating valuations: the council's figure for apportioning rates, not a market appraisal.
John Dee Crescent compared with Red Beach
John Dee Crescent's median council value is 13% below Red Beach's.
| John Dee Crescent | Red Beach | Whangaparāoa | |
|---|---|---|---|
| Median council value | $1.02m | $1.18m | $1.02m |
| Median sale, last 12 months | $1.03m | $1.16m | $975k |
| Sold in the last 12 months | 9.1% | 5.4% | 4.7% |
| Time between sales | 11.5 yrs | 8.6 yrs | 8.5 yrs |
| Median section | 675 m² | 674 m² | 809 m² |
| Median year built | 1980 | 1990 | 1990 |
| Council value per m² of floor | $6k | $7k | $6k |
John Dee Crescent house prices over time
Median sale price by year; 2026 is the year so far. A year with fewer than two sales has no bar.
Sales by year as a table
| Year | Sales | Median price | Per m² floor |
|---|---|---|---|
| 2026 | 3 | $1,102,000 | $5,022 |
| 2025 | 7 | $965,000 | $6,196 |
| 2024 | 2 | $1,050,000 | $8,427 |
| 2023 | 1 | $840,000 | $7,000 |
| 2022 | 2 | $1,184,500 | $5,026 |
| 2021 | 4 | $1,285,500 | $6,444 |
| 2020 | 1 | $855,000 | $9,000 |
| 2019 | 2 | $807,500 | $5,110 |
| 2018 | 5 | $835,000 | $4,395 |
| 2017 | 3 | $845,000 | $5,094 |
| 2016 | 6 | $817,500 | $4,453 |
Recent sales on John Dee Crescent
- 53 John Dee Crescent$889,00012 Jun 2026 · 3 bed · 209 m² floor · 674 m² land
- 57 John Dee Crescent$1,165,00027 May 2026 · 4 bed · 232 m² floor · 674 m² land
- 45 John Dee Crescent$1,102,00027 Jan 2026 · 4 bed · 190 m² floor · 674 m² land
- 3 John Dee Crescent$965,00018 Nov 2025 · 3 bed · 160 m² floor · 675 m² land
- 22 John Dee Crescent$1,425,00023 Oct 2025 · 3 bed · 230 m² floor · 809 m² land
- 10 John Dee Crescent$900,00017 Sept 2025 · 3 bed · 160 m² floor · 674 m² land
- 42 John Dee Crescent$770,00020 Aug 2025 · 233 m² floor · 592 m² land
- 41 John Dee Crescent$918,00029 Jun 2025 · 3 bed · 142 m² floor · 781 m² land
- 7 John Dee Crescent$1,070,00028 Feb 2025 · 3 bed · 137 m² floor · 755 m² land
- 34A John Dee Crescent$1,510,4281 Feb 2025 · 6 bed · 235 m² floor · 762 m² land
- 40 John Dee Crescent$1,050,0002 Oct 2024 · 111 m² floor · 1,226 m² land
- 50 John Dee Crescent$1,050,00016 Jul 2024 · 3 bed · 142 m² floor · 1,090 m² land
- 47 John Dee Crescent$840,0007 Feb 2023 · 3 bed · 120 m² floor · 674 m² land
- 61 John Dee Crescent$1,070,00013 Dec 2022 · 4 bed · 192 m² floor · 708 m² land
- 1/4 John Dee Crescent$1,299,00010 May 2022 · 4 bed · 290 m² floor
- 1 John Dee Crescent$1,301,00014 Dec 2021 · 4 bed · 200 m² floor · 779 m² land
- 3 John Dee Crescent$1,050,0008 Apr 2021 · 3 bed · 160 m² floor · 675 m² land
- 34 John Dee Crescent$1,270,0004 Apr 2021 · 6 bed · 260 m² floor · 708 m² land
- 34A John Dee Crescent$1,500,00018 Mar 2021 · 6 bed · 235 m² floor · 762 m² land
- 8 John Dee Crescent$855,00020 Sept 2020 · 4 bed · 95 m² floor · 674 m² land
The homes on John Dee Crescent
John Dee Crescent has 61 houses and 5 units and townhouses. More were built in the 1980s than in any other decade (47%).
How long owners stay on John Dee Crescent
Homes on John Dee Crescent that resold in the last five years had been held a median 11.5 years (Red Beach: 8.6 years).
Time between a home's sales, for 14 resales in the last five years. A home not sold since our records begin is not counted, so owners who stay longest are under-represented.
Building and resource consents on John Dee Crescent
- 20 John Dee Crescent1 Jul 2026 · Building consentInstall pool fencing.
- 22 John Dee Crescent1 Jun 2026 · Building consentInstall new fire & flue (firenzo encore ag)
- 36 John Dee Crescent1 Mar 2024 · Building consentFor the construction of Unit 9 amended off SR 71975
- 36 John Dee Crescent1 Nov 2023 · Building consentR3 - alterations to existing two storey dwg. New membranes on decks, remedial reclad, insulation, conversion of existing gge to bdrm, 2 new windows (unit 7)
- 35 John Dee Crescent1 Oct 2023 · Building consentCoa reinforced concrete in fill to existing floor slab
- 44 John Dee Crescent3 Aug 2023 · Resource consentTo vary the conditions of resource consent SUB60348218 and SUB60348218-A to change the approved shared private way access to Lots 2 and 3 to create a separate vehicle access for each lot.
More streets in Red Beach
- Whangaparaoa Road195
- Bay Street182
- Rosario Crescent136
- Hibiscus Coast Highway124
- Albatross Road103
- Marellen Drive102
- William Bayes Place100
- Walton Street96
- Red Beach Road95
- Symes Drive79
- Moffat Road78
- Pohutukawa Avenue71
Every street in Red Beach, and the suburb's house prices and sales.
Sales and valuations as at 11 September 2026, from council and LINZ records. Medians resting on fewer than 3 sales are not shown.